
Page 27: of Offshore Engineer Magazine (Apr/May 2014)
Read this page in Pdf, Flash or Html5 edition of Apr/May 2014 Offshore Engineer Magazine
 26
26
 28
28
growing oil substitution are all likely to precipitate a structural moderation in oil demand over the remainder of the decade. On the supply side, output is
Heading for growing rapidly led by North America’s unconventional revolution.
These two factors will boost global spare capacity over the long term.
Indeed, BP estimates this could almost 1 deepwater?
double to 6MMb/d by 2018 . That capac- ity should push down oil prices and help remove some of the geopolitical premium that has so occupied the market over investment decision, and secure appro- recent years.
priate yard space. Delivery could then Secondly, a decade of high prices has take anything between 18-36 months already had a huge impact on global depending on the nature of the asset. exploration and production activity. It
Consequently, newbuild cycles tend to has provided the impetus for the devel- lag oil price signals by a year or two. opment of North America’s unconven-
While the exact timing of the down- tional resources (both tight oil and oil turn is uncertain, it is clear that the new- sands). Just as signi? cantly, although build market may well be approaching perhaps not as newsworthy, volumes are its zenith. There are three main reasons also set to rise from conventional assets for this. across key producers such as Saudi
Firstly, demand and supply funda- Arabia, Iraq, Angola and, perhaps in mentals suggest that oil prices may have due course, Iran. Rig counts across the passed their peak. Improving energy Middle East are at record levels (403) ef? ciency, particularly vehicle ef? ciency, as of January 2014, while the count in the reduced use of crude for direct power Africa is now more than three times 2 generation, slowing emerging market 2000 levels (139) . It is only a matter of
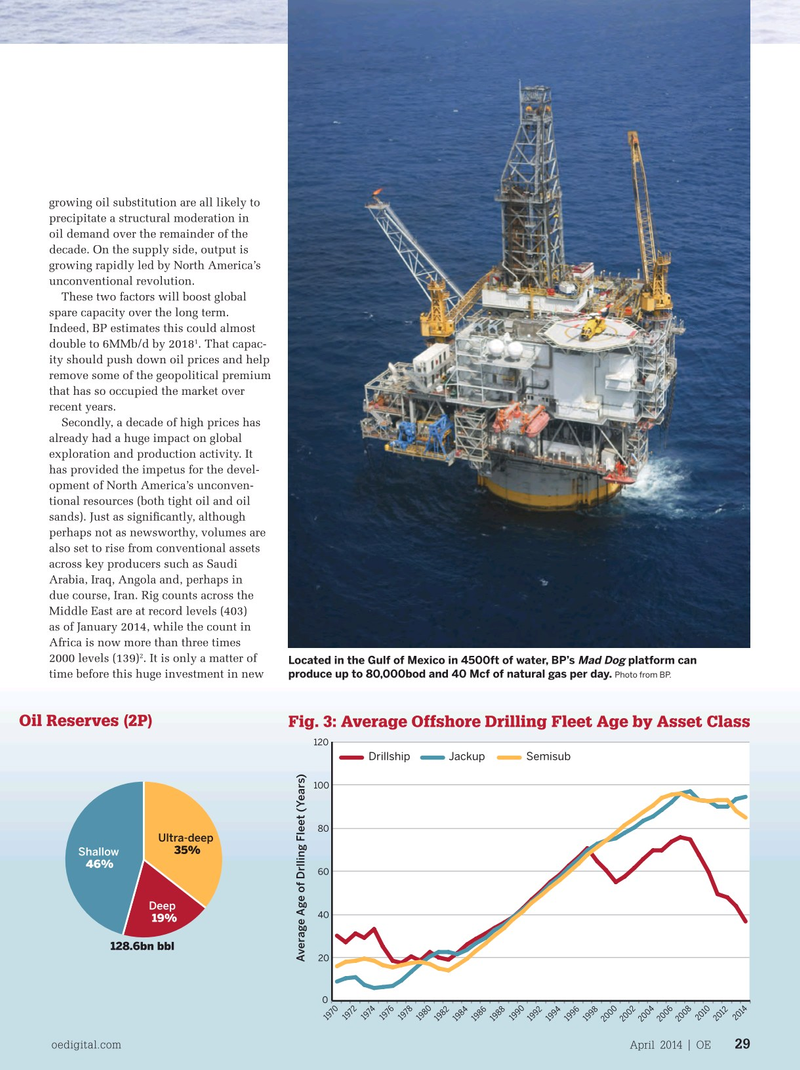
Located in the Gulf of Mexico in 4500ft of water, BP’s platform can Mad Dog produce up to 80,000bod and 40 Mcf of natural gas per day. Photo from BP.
economic growth, subsidy reform, and time before this huge investment in new
Oil Reserves (2P) Fig. 3: Average Offshore Drilling Fleet Age by Asset Class
Fig. 2: Undeveloped Offshore 2000 vs 2013 120
DrillshipJackupSemisub 100 80
Ultra-deep 35%
Shallow 46% 60
Deep 40 19% 128.6bn bbl 20
Average Age of Drlling Fleet (Years) 0 1974 1972 1976 1978 1970 2014 1980 1990 2010 1992 1982 2012 1986 1988 1984 1996 1998 1994 2002 2006 2008 2004 2000 oedigital.com April 2014 | OE 29 000_OE0414_Rigmarket2_Infield.indd 29 3/23/14 11:15 AM