
Page 34: of Offshore Engineer Magazine (Apr/May 2014)
Read this page in Pdf, Flash or Html5 edition of Apr/May 2014 Offshore Engineer Magazine
 33
33
 35
35
Rig Market Review 1 – A robust deepwater inventory more of the capacity being allocated to on oil prices lower than at present. Our
During the past decade, about 40% of analyses suggest that drilling targets non-drilling related activities.
the global ? oating drilling ? eet has been containing as little as 1MMboe could
Not an end, just a growth pause allocated to exploration efforts (Figure provide healthy economics, based on 4), an activity that has yielded results. current oil prices, and we believe this is Coupling lowered upstream investment
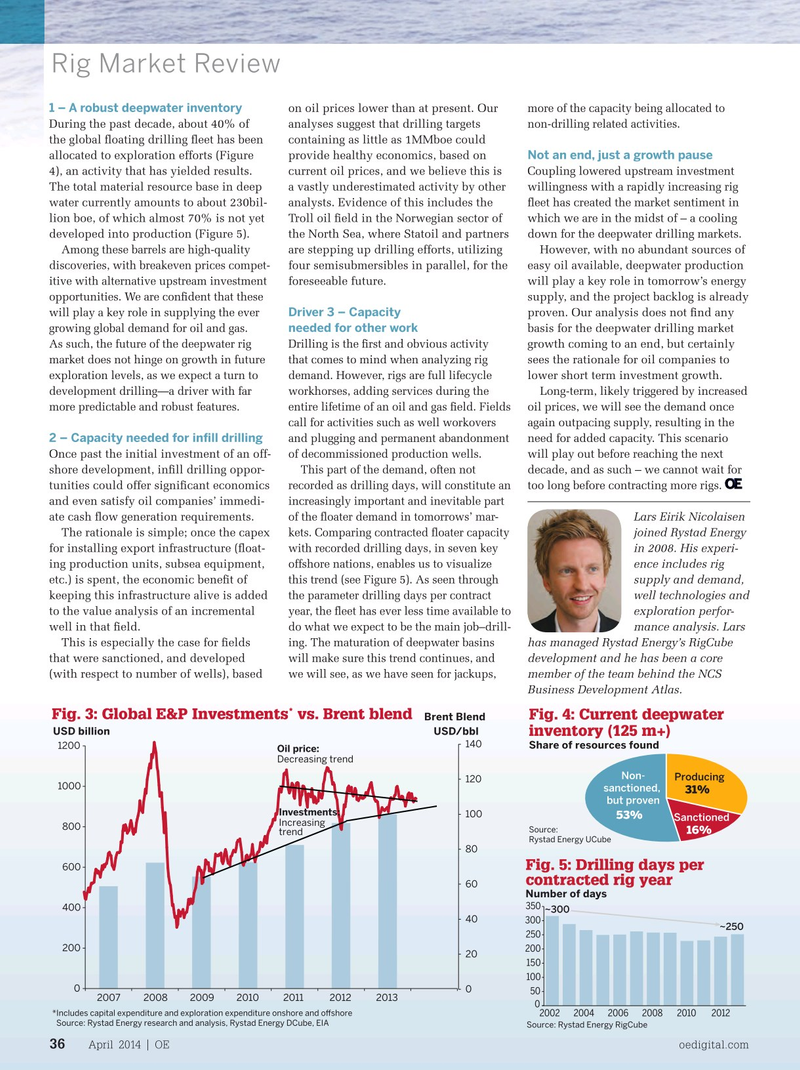
The total material resource base in deep a vastly underestimated activity by other willingness with a rapidly increasing rig water currently amounts to about 230bil- analysts. Evidence of this includes the ? eet has created the market sentiment in lion boe, of which almost 70% is not yet Troll oil ? eld in the Norwegian sector of which we are in the midst of – a cooling developed into production (Figure 5). the North Sea, where Statoil and partners down for the deepwater drilling markets.
Among these barrels are high-quality are stepping up drilling efforts, utilizing However, with no abundant sources of discoveries, with breakeven prices compet- four semisubmersibles in parallel, for the easy oil available, deepwater production itive with alternative upstream investment foreseeable future. will play a key role in tomorrow’s energy opportunities. We are con? dent that these supply, and the project backlog is already
Driver 3 – Capacity will play a key role in supplying the ever proven. Our analysis does not ? nd any needed for other work growing global demand for oil and gas. basis for the deepwater drilling market
As such, the future of the deepwater rig Drilling is the ? rst and obvious activity growth coming to an end, but certainly market does not hinge on growth in future that comes to mind when analyzing rig sees the rationale for oil companies to exploration levels, as we expect a turn to demand. However, rigs are full lifecycle lower short term investment growth. development drilling—a driver with far workhorses, adding services during the
Long-term, likely triggered by increased more predictable and robust features. entire lifetime of an oil and gas ? eld. Fields oil prices, we will see the demand once call for activities such as well workovers again outpacing supply, resulting in the 2 – Capacity needed for in? ll drilling and plugging and permanent abandonment need for added capacity. This scenario
Once past the initial investment of an off- will play out before reaching the next of decommissioned production wells. shore development, in? ll drilling oppor- decade, and as such – we cannot wait for
This part of the demand, often not tunities could offer signi? cant economics too long before contracting more rigs. recorded as drilling days, will constitute an and even satisfy oil companies’ immedi- increasingly important and inevitable part ate cash ? ow generation requirements. Lars Eirik Nicolaisen of the ? oater demand in tomorrows’ mar-
The rationale is simple; once the capex joined Rystad Energy kets. Comparing contracted ? oater capacity for installing export infrastructure (? oat- in 2008. His experi- with recorded drilling days, in seven key ing production units, subsea equipment, ence includes rig offshore nations, enables us to visualize etc.) is spent, the economic bene? t of supply and demand, this trend (see Figure 5). As seen through keeping this infrastructure alive is added well technologies and the parameter drilling days per contract to the value analysis of an incremental exploration perfor- year, the ? eet has ever less time available to well in that ? eld. mance analysis. Lars do what we expect to be the main job–drill-
This is especially the case for ? elds has managed Rystad Energy ’s RigCube ing. The maturation of deepwater basins that were sanctioned, and developed development and he has been a core will make sure this trend continues, and (with respect to number of wells), based member of the team behind the NCS we will see, as we have seen for jackups,
Business Development Atlas.
*
Fig. 3: Global E&P Investments vs. Brent blend Fig. 4: Current deepwater
Brent Blend
USD billion USD/bbl inventory (125 m+) 140
Share of resources found 1200
Oil price:
Decreasing trend
Non-
Producing 120 1000 sanctioned, 31% but proven
Investments: 100 53%
Sanctioned
Increasing 800
Source: 16% trend
Rystad Energy UCube 80
Fig. 5: Drilling days per 600 contracted rig year 60
Number of days 350 ~300 400 40 300 ~250 250 200 200 20 150 100 0 0 50 2007 2008 2009 2010 2011 2012 2013 0 *Includes capital expenditure and exploration expenditure onshore and o