
Page 41: of Offshore Engineer Magazine (Apr/May 2014)
Read this page in Pdf, Flash or Html5 edition of Apr/May 2014 Offshore Engineer Magazine
 40
40
 42
42
Geology & Geophysics another image, and as you mill into the rock model, representing behaviors at sample, you’re getting a 3D volume,” he any distance near or far from the well- says. This provides a representation that is bore, he says.
100 microns across, about the diameter of a
The physical principles in the DHD human hair, Andersen says. This is needed simulator go all the way back to the 19th to see the pore spaces in mudstones.
century, Andersen says. However, rele-
This type of image analysis can mea- vant work began almost 20 years ago with sure porosity and both organic and min- a research scientist in Moscow. That sci- eral content. The surface of the sample entist started working for Schlumberger could be as large as 25mm by 15mm. and began development on the simulator “This is small but in SEM, this is a huge approximately ? ve years ago. amount of real estate,” Andersen says. Schlumberger teamed up with Shell to
The higher resolution provides validate the simulator’s ? uid properties detailed information about the pores, and interactions. Shell used a synchro- which is important because their location tron-based x-ray computed micro-tomog- and the shape help determine what is a raphy (results presented in two papers good pay zone for the client, Andersen at the International Symposium of the says. Society of Core Analysts in September 2013). The analysis showed where ? ow
DHD Simulator of treated ? uid entered a pore. Using the
What’s different about Schlumberger’s same starting point, the simulator was approach, Andersen says, is the DHD able to predict where the ? uid ? owed. (direct hydrodynamic) simulator. This “The two images were very similar,” takes the volume representation of Andersen said. “You’d think it was the the rock and simulates ? ow, allowing same picture.” engineers to see how ? uid ? ows through
The Future the pores. “The simulator uses a model of the ? uid, captures the physical and Physical analysis won’t ever go away,
Schlumberger uses samples of chemical features such as surface tension Andersen says. “The combination of various sizes for physical and and viscosity,” he says. “What’s truly digital and physical core analysis is more digital core analysis. unique about our simulator is it uti- powerful than either alone. Physical
Images: Schlumberger lizes realistic pore geometries and ? uid analysis is a proof point that people have untouched. Scanning gives us a sense of characteristics.” been obtaining for decades. It will be a will rotate the sample a 10th of a degree core recovery – what’s the quality? If the “The DHD simulator allows us to do long time, if ever, before petrophysicists and take another image, eventually ending rock is friable, it may not stand up well to what no one else can do,” Andersen says. are willing to bypass the laboratory work. up with 3,600 backscatter images, which mechanical shaking involved in transport. “We can model behavior of the ? uid and What is likely to happen,” he says, “is helps create a 360-degree view.
CT scanning allows us to determine if the “What we do next is a mathematical answer speci? cs to the client’s reservoir that the balance of emphasis between the core analysis can continue as planned. ” inversion, computing tomography based and reservoir conditions.” This can be two is likely to shift with time toward “The initial CT scan allows identi? cation on the backscatter images, and end up done multiple times on the same digital additional digital analysis.” of different rock types,” Andersen says. with a 3D image of the rock,” Andersen “If you do one energy scan, you cor- says. The process gives a 3D volume with relate to the bulk density of the sample. a resolution of 1-2 microns on a side.
Addition of a second energy level Andersen says this is important with provides information about the effective conventional rocks such as sandstones atomic number; from that we can back and carbonates. Unconventional materi- out chemical information that indicates als will need a higher resolution in the mineralogy,” he says. nanometer range.
Another component of the rock analy-
SEM analysis sis is the heterogeneous rock analysis (HRA), which allows the system to type In order to get to that higher resolu- similar rock characteristics, and label tion, SEM (scanning electron micros- them by color. This helps to obtain more copy) imaging must be conducted. SEM information from limited sample quan- provides a higher level of magni? cation tity. “If I think the black-labeled sample including 2D and 3D images. First, the type is important, HRA coding guides us sample surface is ? attened using argon- in sample selection and also for physical ion mill and later imaged. The 2D images analysis,” Andersen says. show features of the ? at surface, but the
The next step is the microCT scan, 3D images can identify pore connectivity. another X-ray method. Here the typical For 3D imaging, the ion beams are sample size can be 8mm in diameter. The an integral part of the SEM machine,
X-rays shine through the samples to get a Andersen says. “You select a portion of
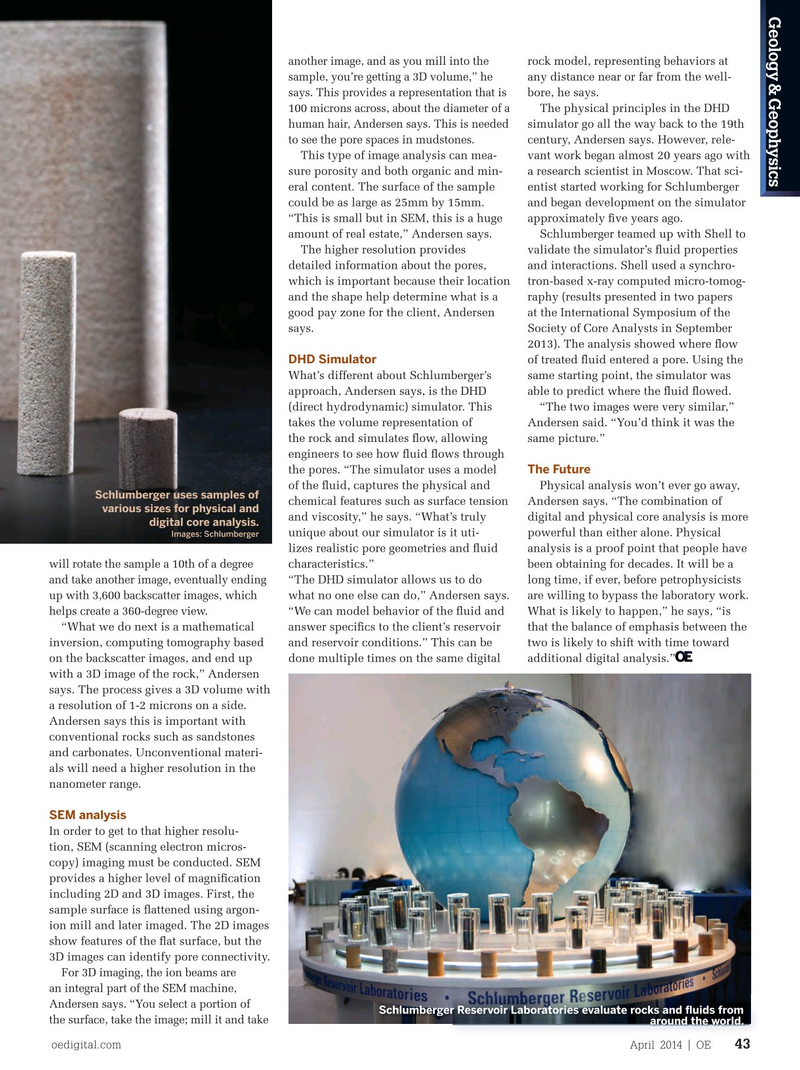
Schlumberger Reservoir Laboratories evaluate rocks and ? uids from backscatter image. Then the lab technicians the surface, take the image; mill it and take around the world.
oedigital.com April 2014 | OE 43 000_OE0414_G&G2_Coreflow.indd 43 3/22/14 11:57 PM