
Page 15: of Offshore Engineer Magazine (Jan/Feb 2020)
Read this page in Pdf, Flash or Html5 edition of Jan/Feb 2020 Offshore Engineer Magazine
 14
14
 16
16
MARKET FPSO
FLOATING PRODUCTION:
THE REBOUND CONTINUES
Jim McCaul – IMA/World Energy Reports ctivity in the deepwater sector took a huge hit
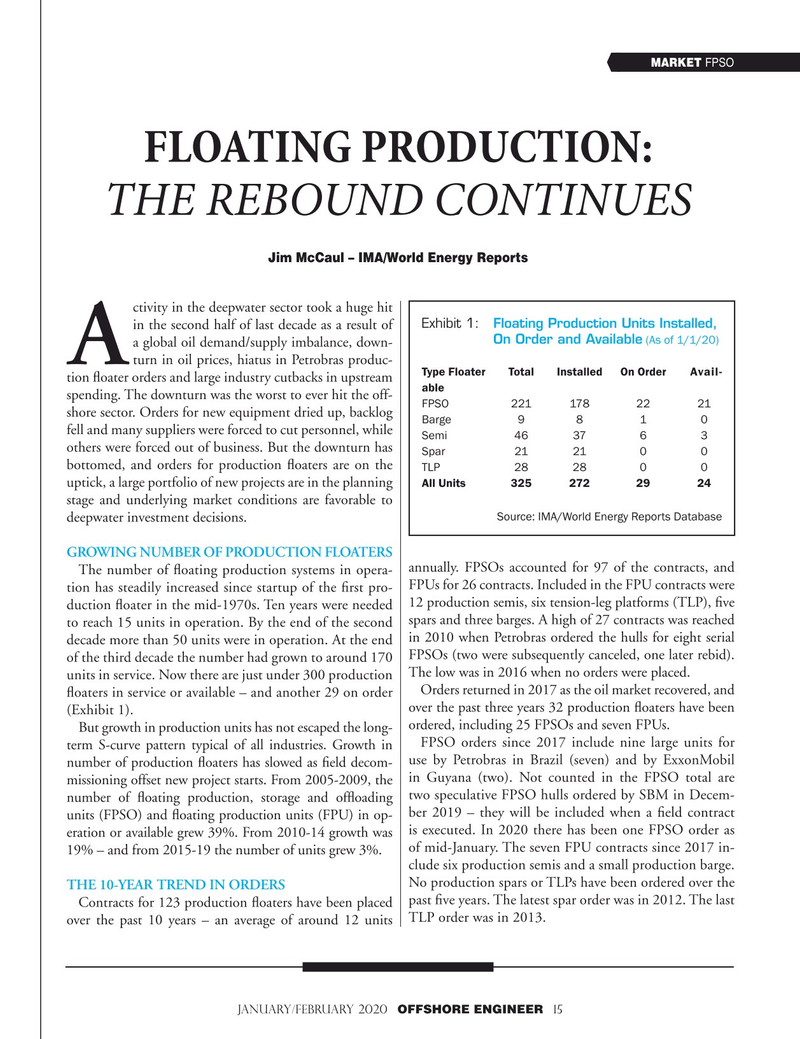
Exhibit 1: Floating Production Units Installed, in the second half of last decade as a result of On Order and Available (As of 1/1/20) a global oil demand/supply imbalance, down- turn in oil prices, hiatus in Petrobras produc-
A
Type Floater Total Installed On Order Avail- tion ? oater orders and large industry cutbacks in upstream able spending. The downturn was the worst to ever hit the off-
FPSO 221 178 22 21 shore sector. Orders for new equipment dried up, backlog
Barge 9 8 1 0 fell and many suppliers were forced to cut personnel, while
Semi 46 37 6 3 others were forced out of business. But the downturn has
Spar 21 21 0 0 bottomed, and orders for production ? oaters are on the
TLP 28 28 0 0 uptick, a large portfolio of new projects are in the planning
All Units 325 272 29 24 stage and underlying market conditions are favorable to
Source: IMA/World Energy Reports Database deepwater investment decisions.
GROWING NUMBER OF PRODUCTION FLOATERS annually. FPSOs accounted for 97 of the contracts, and
The number of ? oating production systems in opera-
FPUs for 26 contracts. Included in the FPU contracts were tion has steadily increased since startup of the ? rst pro- duction ? oater in the mid-1970s. Ten years were needed 12 production semis, six tension-leg platforms (TLP), ? ve to reach 15 units in operation. By the end of the second spars and three barges. A high of 27 contracts was reached decade more than 50 units were in operation. At the end in 2010 when Petrobras ordered the hulls for eight serial of the third decade the number had grown to around 170 FPSOs (two were subsequently canceled, one later rebid). units in service. Now there are just under 300 production The low was in 2016 when no orders were placed.
Orders returned in 2017 as the oil market recovered, and ? oaters in service or available – and another 29 on order over the past three years 32 production ? oaters have been (Exhibit 1).
ordered, including 25 FPSOs and seven FPUs.
But growth in production units has not escaped the long-
FPSO orders since 2017 include nine large units for term S-curve pattern typical of all industries. Growth in use by Petrobras in Brazil (seven) and by ExxonMobil number of production ? oaters has slowed as ? eld decom- missioning offset new project starts. From 2005-2009, the in Guyana (two). Not counted in the FPSO total are number of ? oating production, storage and of? oading two speculative FPSO hulls ordered by SBM in Decem- ber 2019 – they will be included when a ? eld contract units (FPSO) and ? oating production units (FPU) in op- eration or available grew 39%. From 2010-14 growth was is executed. In 2020 there has been one FPSO order as of mid-January. The seven FPU contracts since 2017 in- 19% – and from 2015-19 the number of units grew 3%. clude six production semis and a small production barge.
No production spars or TLPs have been ordered over the
THE 10-YEAR TREND IN ORDERS
Contracts for 123 production ? oaters have been placed past ? ve years. The latest spar order was in 2012. The last over the past 10 years – an average of around 12 units TLP order was in 2013.
JANUARY/FEBRUARY 2020 OFFSHORE ENGINEER 15