Multibeam sonar technology has seen steady advancements leading to higher quality, cleaner data. To capitalize on this technology, hydrographers are consistently adjusting their workflows to deliver detailed and accurate information in an efficient manner. Issues arise due the incorporation of a variety of software solutions within a single non-seamless (acquisition through deliverable) workflow. This often results in an accumulation of human error which leads to inaccurate final products and/or poor decisions with undesirable consequences (Beaudoin, 2017). Advancements in the hydrographic workflow by researchers and engineers at Quality Positioning Systems (QPS) have automated the mundane, human-error prone tasks and guide users through the hydrographic workflow. This workflow removes redundancy, capitalizes on advanced computing technology to provide a dynamic multidimensional user interface that allows those even with a low knowledge threshold to deliver high-quality final products.
Introduction
Beginning in the 1990s, sonar technology evolved from the analog to digital allowing users to utilize multiple datagrams inherent within multibeam mapping solutions. For example, seafloor interpretation evolved from hand-pasted sidescan mosaics with hand-contoured mylar overlays to semi-automated processing incorporating sophisticated algorithms such as CUBE (Calder, 2003) and Geocoder (Fonseca, 2005). While hydrographic hardware advancements are exponentially improving, hydrographic software data processing and their associated workflows still provide challenges for even the most experienced users. While software generally keeps pace with the advancements in hardware and processing methods, many of the frustrations are present because human operators must connect all the pieces together to come up with a final processing solution (Beaudoin, 2017). A paradigm shift is currently underway to isolate the human error in the modern day hydrographic workflow while maximizing advancements in computing technology to automate the mundane, error prone tasks.
Uncertainty
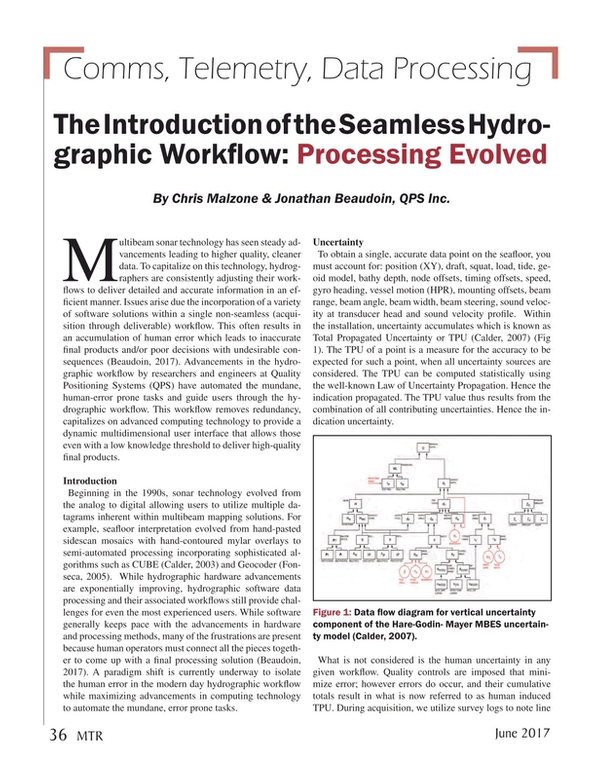
To obtain a single, accurate data point on the seafloor, you must account for: position (XY), draft, squat, load, tide, geoid model, bathy depth, node offsets, timing offsets, speed, gyro heading, vessel motion (HPR), mounting offsets, beam range, beam angle, beam width, beam steering, sound velocity at transducer head and sound velocity profile. Within the installation, uncertainty accumulates which is known as Total Propagated Uncertainty or TPU (Calder, 2007) (Fig 1). The TPU of a point is a measure for the accuracy to be expected for such a point, when all uncertainty sources are considered. The TPU can be computed statistically using the well-known Law of Uncertainty Propagation. Hence the indication propagated. The TPU value thus results from the combination of all contributing uncertainties. Hence the indication uncertainty.
What is not considered is the human uncertainty in any given workflow. Quality controls are imposed that minimize error; however errors do occur, and their cumulative totals result in what is now referred to as human induced TPU. During acquisition, we utilize survey logs to note line names, positions, start/stop times, features (shoals, wrecks) and unique observations that may pertain to any line. During data processing, we incorporate checklists to ensure proper application of such things as tides, sound velocity, post-processed heave, etc. The common denominator with survey logs and checklists is that they require manual (analog) input with cognitive feedback to ensure quality. Unlike systematic TPU which can be calculated human TPU is unpredictable and cannot be measured. Typical areas for Human TPU are:
- Transcription: There may be up to three different coordinate frame conventions that exist within a single installation spread across a minimum of eight software interfaces (Fig. 2).
- Processing: Failing to apply imported ancillary data
- Reprocessing:
o Changing configurations and then not triggering the appropriate reprocessing
o Not triggering the appropriate reprocessing for the files that need it
Minimizing TPU, both systematic and human represent a logical evolution in the ocean mapping workflow.
Guiding the User
Real-Time Improvements
Standard software hydrographic software solutions are governed by menu-driven Graphical User Interface (GUI) that reference files structured through a folder organization within the computer hard drive. Current practice requires users to self-navigate themselves to construct a very specific folder structure (eg Windows Explorer) while manually linking the logging and/or processing software to these folders.
In the year 2000, QPS introduced the guided workflow to the QINSy software to assist their users in the setup process. The process includes a guided wizard based setup for project preparation, including automated folder creation; template database creation (guided geodesy, vessel setup, hardware interfacing); and online preparation, including data recording setup, pre-data filtering, calibrations and field checks.
Paradigm Shift
The production of high quality products from high-resolution data is a difficult task even for the experienced hydrographer. Despite field procedure improvements, the hydrographic workflow is complex since it requires a human to connect all the pieces to produce a final product. Following in suite with the QINSy model, QPS has evolved the guided workflow into the processing portion of the workflow. The solution is known as Qimera and represents a paradigm shift in hydrographic processing. Qimera incorporates the QINSy hydrographic engine with the Fledermaus 4D visualization and multicore processing engines to provide users with a seamless, dynamic and pleasant work environment. It performs complete hydrographic processing for most modern sonar formats (.db, .all, .s7k, .hsx, .jsf, .gsf, etc), support many ancillary formats (SBET, PosPac, most tides and SVP) and exports to a variety of formats (GSF, FAU, BAG, Arc and other image formats).
The Qimera paradigm shift is the reduction of human induced TPU. This is accomplished through automation of mundane and error prone tasks (transcription automation and processing state management) to isolate the stages for which the hydrographer is best suited. Examples of such stages include data validation, processing configuration management and trouble-shooting. To accomplish this, two types of workflows are incorporated: guided and dynamic. The guided workflow allows for non-expert users to arrive at typical bathymetric deliverables with little training or expert knowledge. The dynamic workflow is processing state management which codifies and manages the relationships between the observations and the results. You don’t need to remember what processing need to be done, but rather that some processing must be done. Everybody, regardless or knowledge or experience should be able to walk away with a product.
Using What’s Already There
The guided workflow within Qimera is simply a series of prompts that step the user from one stage to the next. However, the innovation lies in the background. Upon opening Qimera, a minimum of seven functions are automated. For example, creating a project establishes the file structure, organizes by file type (processed, grid, image, SVP, tide, SBET) and structures where all raw and soon-to-be processed data will be stored. Most modern file formats (.dB, .all, .s7k, .gsf) contain all the necessary information required for processing as setup prior and during acquisition. Qimera utilizes all available information to guide the user thus eliminating the necessity of manual checklists. File import searches each format for what information exists (range, angle, motion, dynamic heave, SV, SVP, etc), catalogs it, transcribes all vessel configuration information, processing configuration and then performs the initial processing such ray tracing based on the all raw data (bathy and ancillary), etc. Following the initial automated processing, Qimera prompts you as to how you wish to create your surface. Resolution, CUBE settings and color map are presented in a simplified interface. Within five-clicks and in under 60 seconds, the user has a map and is now ready to utilize one or many of Qimera’s data editing tools to clean and validate your data, apply SBET’s or edit and validate both the assembled bathymetric data and the ancillary data used to calculate them.
Data validation consists of creating a loop between the observed surface and calculated results to expose errors immediately. This is referred to as live processing state management. In Qimera it is very easy to make processing configuration adjustments or to perform data validation and to immediately asses the impacts of changes. Near immediate feedback shortens the time between cause and effect while promoting causal reasoning which is a key ingredient for natural cognitive evolution. In short, it allows users to train themselves through something as simple as immediately recalculating the dynamic surface and showing the user they have accidentally deleted good data or applied the wrong SVP, etc (Fig 3). Visual feedback on cause and effect.
Scalability: Collaboration & Production Line Processing
QPS provides workflows within Qimera to that scale to multiple users contributing to an overall processing effort through cooperative cleaning and production line processing. Cooperative cleaning allows multiple users to clean a large project by dividing it into smaller, more manageable projects while also maintaining data integrity. Data processors work within their subprojects and, once complete, introduce their efforts back into the main project. In parallel, the main project may have ancillary data processing completed (eg SBET, SVP, height corrections). The edits from the subprojects may be incorporated back into the main project without impacting the overall progress of the entire project but enormously increasing efficiency.
Product line processing allows for projects to be broken down into stages. These stages can be done based on survey days, survey segments, survey vessels, etc. The processing for a stage (eg a day, vessel, segment) of data is handled in its own processing project. The processed outputs from this effort can be aggregated into a master project where it is evaluated by the senior hydrographer review. During review, the stage project may be accepted and immediately incorporated into the master projects or sent back for additional processing. This is done repeatedly and combined with other stages within the master project. The net result is the integration of multiple smaller projects processed in the exact same manner into a final deliverable.
The hydrographic workflow has evolved to provide a dynamic multidimensional user interface that allows those even with a low knowledge threshold to make good decisions that lead to high-end final products.
The critical component is the isolation of tasks within the workflow to capitalize on the technological advances in computing technology to automate the mundane error prone tasks to bring more value to the stages in which the human brain brings value. QPS through QINSy and Qimera innovate the user experience through several key design features including: guided workflow, transcription automation, processing state management, real-time QA, the dynamic workflow for validation, collaborative cleaning and production line processing. This reduces human error, the QA burden in general and lowers the knowledge barrier to entry.
For the hydrographic manager, the return on investment is found in lower trainings costs due to the guided workflow (easier to learn and retain knowledge), improved processing outcomes, scalability, reduced post-processing times and better results.
References
- Beaudoin, Jonathan, Doucet, Moe, Advances in Hydrographic Data Processing: Time for a Paradigm Shift, U.S. Hydrographic Conference (HS Hydro), Galveston, TX, USA, March 2017.
- Calder, Brian R, How to Run CUBE (with the Baseline CCOM/JHC Implementation), Internal Report, University of New Hampshire (UNH), Center for Coastal and Ocean Mapping (CCOM)/Joint Hydrographic Center (JHC), 2003.
- Calder, Brian R, Wells, David, CUBE User’s Manual, (Version 1.13), University of New Hampshire (UNH), Center for Coastal and Ocean Mapping (CCOM)/Joint Hydrographic Center (JHC), 2007.
- Fonseca. Luciano and Calder, Brian R, Geocoder: An Efficient Backscatter Map Constructor, U.S. Hydrographic Conference (US HYDRO). San Diego, CA, USA, pp. 0-0, 2005.
The Authors
Chris Malzone is the General Manager for Quality Positioning Services, Inc. Malzone has an MS in Oceanography/Geology and has worked in hydrography and related ocean sciences since 1992 in a variety of roles ranging from Scientist to Hydrographer to General Manager.
Dr. Jonathan Beaudoin is QPS Chief Scientist. Beaudoin has undergraduate degrees in Geomatics Engineering and Computer Science from the University of New Brunswick (UNB) in Fredericton, NB, Canada, where he also completed his PhD studies in the field of refraction related echo sounding uncertainty.