
Page 16: of Maritime Logistics Professional Magazine (Q3 2014)
Power & Fuel Management
Read this page in Pdf, Flash or Html5 edition of Q3 2014 Maritime Logistics Professional Magazine
 15
15
 17
17
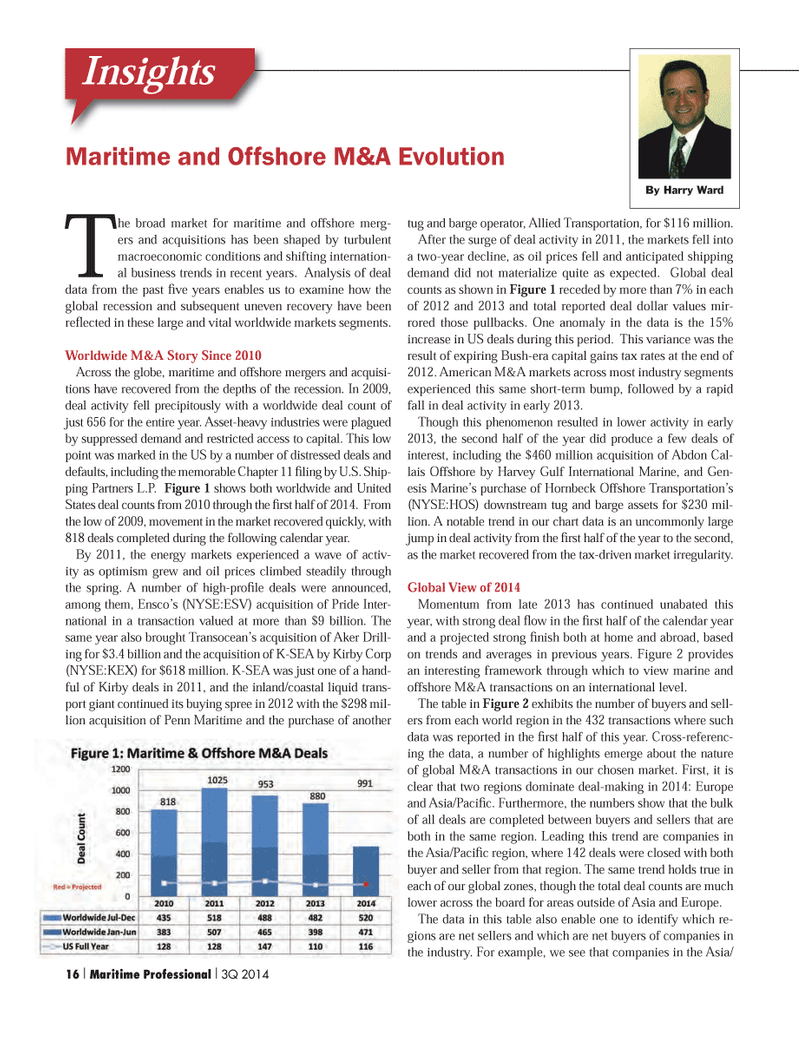
The broad market for maritime and offshore merg- ers and acquisitions has been shaped by turbulent macroeconomic conditions and shifting internation-al business trends in recent years. Analysis of deal data from the past Þ ve years enables us to examine how the global recession and subsequent uneven recovery have been reß ected in these large and vital worldwide markets segments. Worldwide M&A Story Since 2010 Across the globe, maritime and offshore mergers and acquisi- tions have recovered from the depths of the recession. In 2009, deal activity fell precipitously with a worldwide deal count of just 656 for the entire year. Asset-heavy industries were plagued by suppressed demand and restricted access to capital. This low point was marked in the US by a number of distressed deals and defaults, including the memorable Chapter 11 Þ ling by U.S. Ship- ping Partners L.P. Figure 1 shows both worldwide and United States deal counts from 2010 through the Þ rst half of 2014. From the low of 2009, movement in the market recovered quickly, with 818 deals completed during the following calendar year. By 2011, the energy markets experienced a wave of activ- ity as optimism grew and oil prices climbed steadily through the spring. A number of high-proÞ le deals were announced, among them, EnscoÕs (NYSE:ESV) acquisition of Pride Inter- national in a transaction valued at more than $9 billion. The same year also brought TransoceanÕs acquisition of Aker Drill- ing for $3.4 billion and the acquisition of K-SEA by Kirby Corp (NYSE:KEX) for $618 million. K-SEA was just one of a hand- ful of Kirby deals in 2011, and the inland/coastal liquid trans-port giant continued its buying spree in 2012 with the $298 mil- lion acquisition of Penn Maritime and the purchase of another tug and barge operator, Allied Transportation, for $116 million. After the surge of deal activity in 2011, the markets fell into a two-year decline, as oil prices fell and anticipated shipping demand did not materialize quite as expected. Global deal counts as shown in Figure 1 receded by more than 7% in each of 2012 and 2013 and total reported deal dollar values mir- rored those pullbacks. One anomaly in the data is the 15% increase in US deals during this period. This variance was the result of expiring Bush-era capital gains tax rates at the end of 2012. American M&A markets across most industry segments experienced this same short-term bump, followed by a rapid fall in deal activity in early 2013. Though this phenomenon resulted in lower activity in early 2013, the second half of the year did produce a few deals of interest, including the $460 million acquisition of Abdon Cal- lais Offshore by Harvey Gulf International Marine, and Gen- esis MarineÕs purchase of Hornbeck Offshore TransportationÕs (NYSE:HOS) downstream tug and barge assets for $230 mil- lion. A notable trend in our chart data is an uncommonly large jump in deal activity from the Þ rst half of the year to the second, as the market recovered from the tax-driven market irregularity. Global View of 2014 Momentum from late 2013 has continued unabated this year, with strong deal ß ow in the Þ rst half of the calendar year and a projected strong Þ nish both at home and abroad, based on trends and averages in previous years. Figure 2 provides an interesting framework through which to view marine and offshore M&A transactions on an international level. The table in Figure 2 exhibits the number of buyers and sell- ers from each world region in the 432 transactions where such data was reported in the Þ rst half of this year. Cross-referenc- ing the data, a number of highlights emerge about the nature of global M&A transactions in our chosen market. First, it is clear that two regions dominate deal-making in 2014: Europe and Asia/PaciÞ c. Furthermore, the numbers show that the bulk of all deals are completed between buyers and sellers that are both in the same region. Leading this trend are companies in the Asia/PaciÞ c region, where 142 deals were closed with both buyer and seller from that region. The same trend holds true in each of our global zones, though the total deal counts are much lower across the board for areas outside of Asia and Europe. The data in this table also enable one to identify which re-gions are net sellers and which are net buyers of companies in the industry. For example, we see that companies in the Asia/ Maritime and Offshore M&A Evolution InsightsBy Harry Ward 16 I Maritime Professional I 3Q 20141-17 Q3 MP2014.indd 161-17 Q3 MP2014.indd 168/13/2014 4:03:39 PM8/13/2014 4:03:39 PM