Page 63: of Maritime Logistics Professional Magazine (Q3 2016)
Shipbuilding, Repair & Maintenance
Read this page in Pdf, Flash or Html5 edition of Q3 2016 Maritime Logistics Professional Magazine
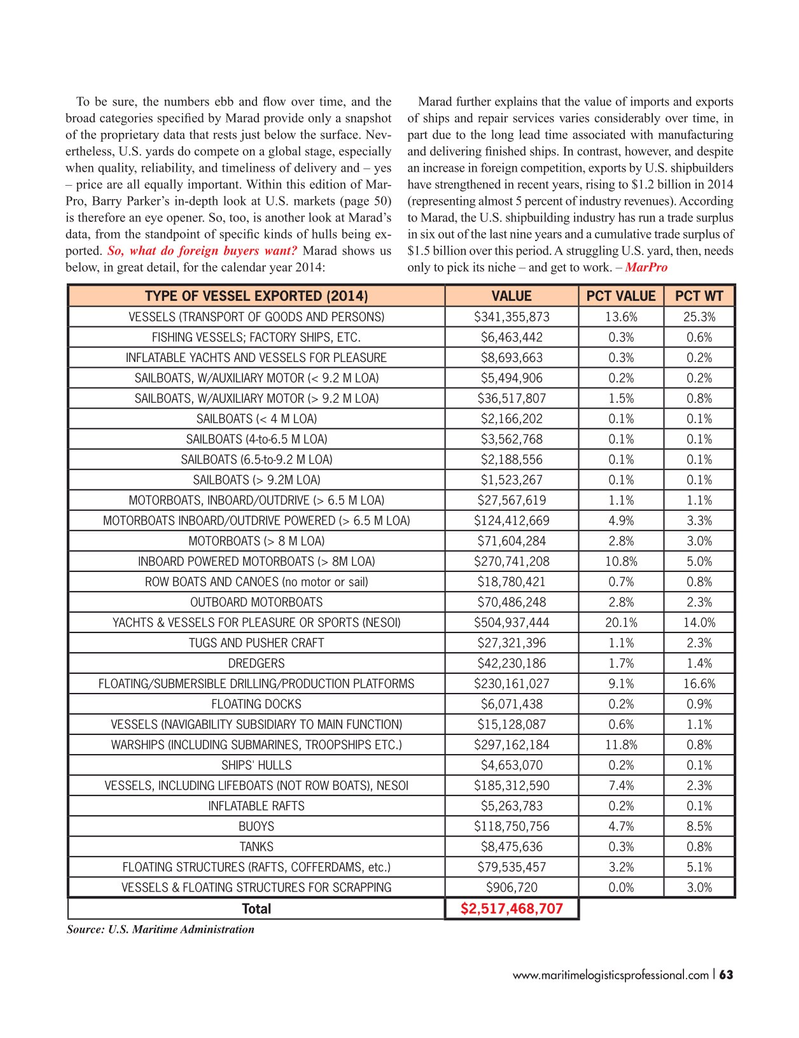
To be sure, the numbers ebb and ? ow over time, and the Marad further explains that the value of imports and exports broad categories speci? ed by Marad provide only a snapshot of ships and repair services varies considerably over time, in of the proprietary data that rests just below the surface. Nev- part due to the long lead time associated with manufacturing ertheless, U.S. yards do compete on a global stage, especially and delivering ? nished ships. In contrast, however, and despite when quality, reliability, and timeliness of delivery and – yes an increase in foreign competition, exports by U.S. shipbuilders – price are all equally important. Within this edition of Mar- have strengthened in recent years, rising to $1.2 billion in 2014
Pro, Barry Parker’s in-depth look at U.S. markets (page 50) (representing almost 5 percent of industry revenues). According is therefore an eye opener. So, too, is another look at Marad’s to Marad, the U.S. shipbuilding industry has run a trade surplus data, from the standpoint of speci? c kinds of hulls being ex- in six out of the last nine years and a cumulative trade surplus of ported. So, what do foreign buyers want? Marad shows us $1.5 billion over this period. A struggling U.S. yard, then, needs below, in great detail, for the calendar year 2014: only to pick its niche – and get to work. – MarPro
TYPE OF VESSEL EXPORTED (2014) VALUEPCT VALUEPCT WT
VESSELS (TRANSPORT OF GOODS AND PERSONS) $341,355,87313.6%25.3%
FISHING VESSELS; FACTORY SHIPS, ETC. $6,463,442 0.3%0.6%
INFLATABLE YACHTS AND VESSELS FOR PLEASURE $8,693,663 0.3%0.2%
SAILBOATS, W/AUXILIARY MOTOR (< 9.2 M LOA) $5,494,906 0.2%0.2%
SAILBOATS, W/AUXILIARY MOTOR (> 9.2 M LOA) $36,517,807 1.5%0.8%
SAILBOATS (< 4 M LOA) $2,166,202 0.1%0.1%
SAILBOATS (4-to-6.5 M LOA) $3,562,768 0.1%0.1%
SAILBOATS (6.5-to-9.2 M LOA) $2,188,556 0.1%0.1%
SAILBOATS (> 9.2M LOA) $1,523,267 0.1%0.1%
MOTORBOATS, INBOARD/OUTDRIVE (> 6.5 M LOA) $27,567,619 1.1%1.1%
MOTORBOATS INBOARD/OUTDRIVE POWERED (> 6.5 M LOA) $124,412,6694.9%3.3%
MOTORBOATS (> 8 M LOA) $71,604,284 2.8%3.0%
INBOARD POWERED MOTORBOATS (> 8M LOA) $270,741,20810.8%5.0%
ROW BOATS AND CANOES (no motor or sail) $18,780,421 0.7%0.8%
OUTBOARD MOTORBOATS $70,486,248 2.8%2.3%
YACHTS & VESSELS FOR PLEASURE OR SPORTS (NESOI) $504,937,44420.1%14.0%
TUGS AND PUSHER CRAFT $27,321,396 1.1%2.3%
DREDGERS $42,230,186 1.7%1.4%
FLOATING/SUBMERSIBLE DRILLING/PRODUCTION PLATFORMS$230,161,0279.1%16.6%
FLOATING DOCKS $6,071,438 0.2%0.9%
VESSELS (NAVIGABILITY SUBSIDIARY TO MAIN FUNCTION) $15,128,087 0.6%1.1%
WARSHIPS (INCLUDING SUBMARINES, TROOPSHIPS ETC.) $297,162,18411.8%0.8%
SHIPS' HULLS $4,653,070 0.2%0.1%
VESSELS, INCLUDING LIFEBOATS (NOT ROW BOATS), NESOI $185,312,5907.4%2.3%
INFLATABLE RAFTS $5,263,783 0.2%0.1%
BUOYS $118,750,7564.7%8.5%
TANKS $8,475,636 0.3%0.8%
FLOATING STRUCTURES (RAFTS, COFFERDAMS, etc.) $79,535,457 3.2%5.1%
VESSELS & FLOATING STRUCTURES FOR SCRAPPING $906,720 0.0%3.0%
Total $2,517,468,707
Source: U.S. Maritime Administration
I www.maritimelogisticsprofessional.com 63 50-63 Q3 MP2016.indd 63 8/17/2016 10:30:07 AM

 62
62

 64
64
