
Page 44: of Maritime Logistics Professional Magazine (Jul/Aug 2017)
PORTS & INFRASTRUCTURE
Read this page in Pdf, Flash or Html5 edition of Jul/Aug 2017 Maritime Logistics Professional Magazine
 43
43
 45
45
STATISTICS
H g l landicapping tHe lobal iner ineup
There are many ways to look at the containership market to- the past year, driving growth and pushing business perfor- day. Fleet size, market percentage, TEU’s controlled, proft and mance fgures from deep red into black.” From a 2016 that losses – you name it, the sector has its many benchmarks. For saw the collapse of Hanjin and the top 20 market players post- example, the Alphaliner (www.alphaliner.com) TOP 100 pro- ing combined net losses of USD 5 billion (Wall Street Jour- vides a constantly updated ranking of the 100 largest container/ nal), 2017 is shaping up to be a good year.
liner operators as well as global capacity fgures taking into ac- Take a look, for example, at recently announced fnancials for count the feets of virtually all container operators worldwide. the number 4 and 5 (respectively) ranked boxship frms, COS-
In this edition (CREDIT: Alphaliner) we provide a smaller CO and Hapag-Lloyd. COSCO’s H1 2017 profts attributable snapshot of that voluminous and well-respected database. to equity holders was reported to HK$206 million, increased
Today, APM Maersk continues its perch atop the global box- by 42% as compared to same period of 2016. Separately, ship feets, controlling as many as 656 ships, more than 1.7 mil- Hapag-Lloyd’s reported proft before interest and tax (EBIT) lion TEU and almost 16.7% of the global market share. The top in the frst six months came to 87.3 million euros ($104.55 mil- 10 liner operators furthermore control as much as 75% of the lion), up from a year-earlier loss of 39.7 million, the company world’s container feet and capacity, with the top fve operators said. It posted a 16 million euro net proft in the second quarter, accounting for 60% of the totals (and 78% of the top 10 share). compared with a 99.3 million loss last year. Those kinds of
But, the burning question on most stakeholders’ minds is: how number are common across the sector for the bigger players.
are we doing as a sector? It all depends on how you look at it. Xeneta CEO Patrik Berglund explained, “Maersk’s recent
As promised, the newly expanded Panama Canal has deliv- 2017 Q2 fnancial report provides an interesting snapshot of ered record volumes to many U.S. ports this year. That metric, the industry,” he notes. “Higher freight rates propelled rev- in part, is a function of a recovering and (in some areas) red enues upwards by 8.4% to almost USD 10 billion for the quar- hot economy, but bigger, deeper and wider tonnage is the rule ter. Meanwhile, reports suggest that Hapag-Lloyd will triple in North America, all of which delivers more boxes per voy- its earnings this year.” Berland also noted that, as described age. U.S. ports, as a general statement are showing year-on- above, that U.S. containerized ports are busier than ever, han- year gains of 5 to 7 percent in volume; some of those boasting dling a projected (record) 1.75 million TEU this month in all-time record monthly and yearly volumes. That translates August alone. And, this comes despite the Trump administra- into more business for boxships. But, are they making money? tion’s so-called ‘America First’ doctrine and withdrawal from
It turns out that they are. Xeneta (www.xeneta.com), a frm initiatives like the Trans-Pacifc Partnership. that gathers global shipping data from a community of over The restructuring of industry alliances – Xeneta says that 90% 700 businesses, covering more than 160,000 port-to-port of all container ship traffc is now accounted for by three ma- pairings and over 35 million contracted rates, recently said jor alliances (THE Alliance, OCEAN and 2M) – and Hanjin’s that “new alliances, structural change and positive economic demise have all contributed to boost rates. Nevertheless, Xe- trends have transformed the container shipping market over neta also cautions that despite long-term rates that are, in some
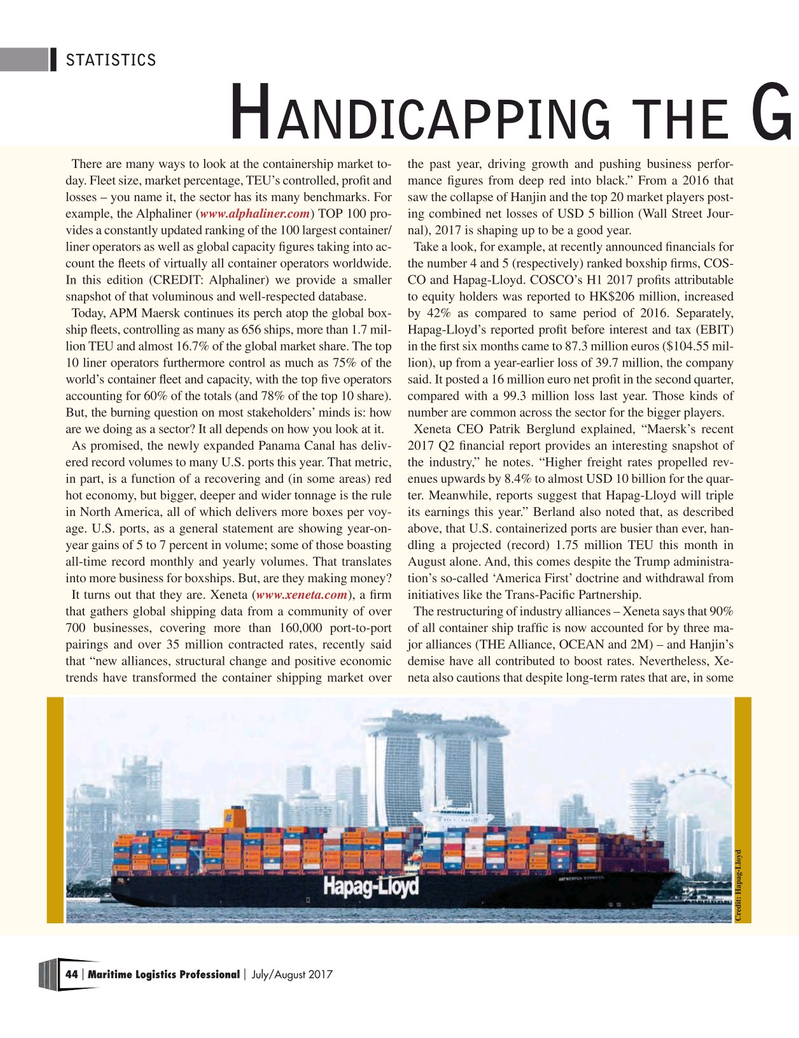
Credit: Hapag-Lloyd 44 Maritime Logistics Professional July/August 2017 | |