Page 47: of Maritime Logistics Professional Magazine (May/Jun 2018)
Container Ports
Read this page in Pdf, Flash or Html5 edition of May/Jun 2018 Maritime Logistics Professional Magazine
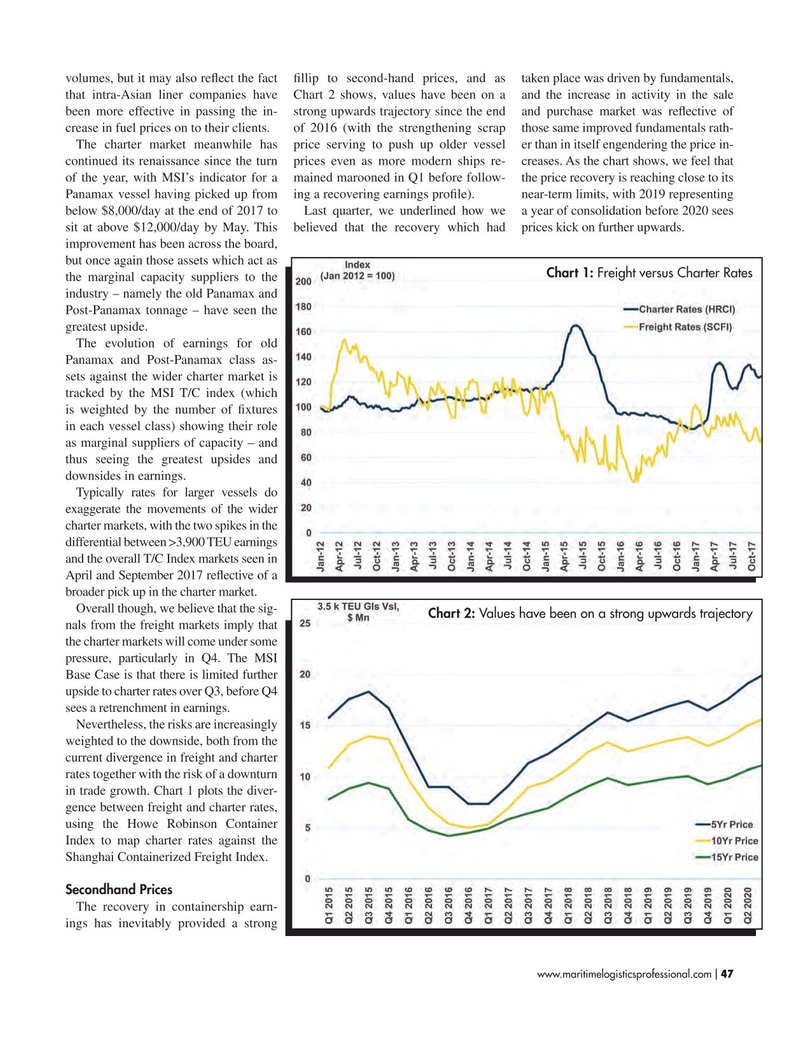
volumes, but it may also refect the fact fllip to second-hand prices, and as taken place was driven by fundamentals, that intra-Asian liner companies have Chart 2 shows, values have been on a and the increase in activity in the sale been more effective in passing the in- strong upwards trajectory since the end and purchase market was refective of crease in fuel prices on to their clients. of 2016 (with the strengthening scrap those same improved fundamentals rath-
The charter market meanwhile has price serving to push up older vessel er than in itself engendering the price in- continued its renaissance since the turn prices even as more modern ships re- creases. As the chart shows, we feel that of the year, with MSI’s indicator for a mained marooned in Q1 before follow- the price recovery is reaching close to its
Panamax vessel having picked up from ing a recovering earnings profle). near-term limits, with 2019 representing below $8,000/day at the end of 2017 to Last quarter, we underlined how we a year of consolidation before 2020 sees sit at above $12,000/day by May. This believed that the recovery which had prices kick on further upwards.
improvement has been across the board, but once again those assets which act as
Chart 1: Freight versus Charter Rates the marginal capacity suppliers to the industry – namely the old Panamax and
Post-Panamax tonnage – have seen the greatest upside.
The evolution of earnings for old
Panamax and Post-Panamax class as- sets against the wider charter market is tracked by the MSI T/C index (which is weighted by the number of fxtures in each vessel class) showing their role as marginal suppliers of capacity – and thus seeing the greatest upsides and downsides in earnings.
Typically rates for larger vessels do exaggerate the movements of the wider charter markets, with the two spikes in the differential between >3,900 TEU earnings and the overall T/C Index markets seen in
April and September 2017 refective of a broader pick up in the charter market.
Overall though, we believe that the sig-
Chart 2: Values have been on a strong upwards trajectory nals from the freight markets imply that the charter markets will come under some pressure, particularly in Q4. The MSI
Base Case is that there is limited further upside to charter rates over Q3, before Q4 sees a retrenchment in earnings.
Nevertheless, the risks are increasingly weighted to the downside, both from the current divergence in freight and charter rates together with the risk of a downturn in trade growth. Chart 1 plots the diver- gence between freight and charter rates, using the Howe Robinson Container
Index to map charter rates against the
Shanghai Containerized Freight Index.
Secondhand Prices
The recovery in containership earn- ings has inevitably provided a strong www.maritimelogisticsprofessional.com 47
I

 46
46

 48
48
