Page 47: of Maritime Logistics Professional Magazine (Mar/Apr 2019)
Container Ports
Read this page in Pdf, Flash or Html5 edition of Mar/Apr 2019 Maritime Logistics Professional Magazine
 46
46
 48
48
STATISTICS world’s largest container ships for the ?rst time to pass under it one port, the NWSA or Northwest Seaport Alliance. And they count and serve terminals in New York and New Jersey. NY/NJ as one giant port. As you can see from the next list that would
The top 10 global shipping lines control 84 percent of the world’s reduce six ports among the top 10 to three, and move others up.
container capacity, up from 53 percent in 2006. And consolidation is To portray an accurate picture of TEUs at the ports including sure to continue. As Maersk CEO Soren Skou said to the Financial import TEUs, export TEUs and empty TEUs we have decided to
Times, “The industry is expected to consolidate further leaving about use the little known Port Performance Freight Statistic Report to 5-6 major global carriers in the next decade or so to run the market.” Congress 2017 to report the 2017 totals. To report the 2018 totals
Already, many lists by TEU include Los Angeles/Long Beach to- we have used the ports’ own statistics from 2018 as described in gether as San Pedro Bay. They include SeaTac or Seattle/Tacoma as each of their press releases.
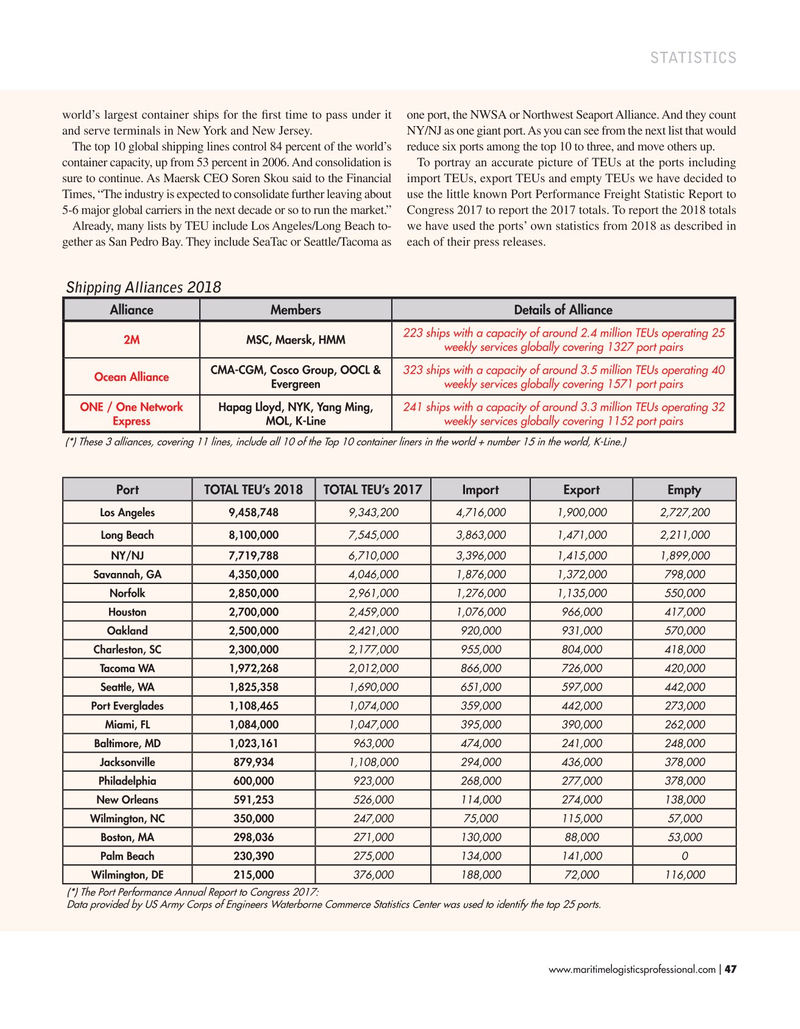
Shipping Alliances 2018
AllianceMembersDetails of Alliance 223 ships with a capacity of around 2.4 million TEUs operating 25 2M MSC, Maersk, HMM weekly services globally covering 1327 port pairs
CMA-CGM, Cosco Group, OOCL & 323 ships with a capacity of around 3.5 million TEUs operating 40
Ocean Alliance
Evergreen weekly services globally covering 1571 port pairs
ONE / One Network Hapag Lloyd, NYK, Yang Ming, 241 ships with a capacity of around 3.3 million TEUs operating 32
Express MOL, K-Line weekly services globally covering 1152 port pairs (*) These 3 alliances, covering 11 lines, include all 10 of the Top 10 container liners in the world + number 15 in the world, K-Line.)
PortTOTAL TEU’s 2018TOTAL TEU’s 2017ImportExportEmpty
Los Angeles9,458,748 9,343,2004,716,0001,900,0002,727,200
Long Beach8,100,000 7,545,0003,863,0001,471,0002,211,000
NY/NJ7,719,788 6,710,0003,396,0001,415,0001,899,000
Savannah, GA4,350,000 4,046,0001,876,0001,372,000798,000
Norfolk2,850,000 2,961,0001,276,0001,135,000550,000
Houston 2,700,000 2,459,0001,076,000966,000417,000
Oakland2,500,000 2,421,000920,000931,000570,000
Charleston, SC2,300,000 2,177,000955,000804,000418,000
Tacoma WA1,972,268 2,012,000866,000726,000420,000
Seattle, WA1,825,358 1,690,000651,000597,000442,000
Port Everglades1,108,465 1,074,000359,000442,000273,000
Miami, FL1,084,000 1,047,000395,000390,000262,000
Baltimore, MD1,023,161 963,000474,000241,000248,000
Jacksonville879,934 1,108,000294,000436,000378,000
Philadelphia600,000 923,000268,000277,000378,000
New Orleans591,253 526,000114,000274,000138,000
Wilmington, NC350,000 247,00075,000115,00057,000
Boston, MA298,036 271,000130,00088,00053,000
Palm Beach230,390 275,000134,000141,0000
Wilmington, DE215,000 376,000188,00072,000116,000 (*) The Port Performance Annual Report to Congress 2017:
Data provided by US Army Corps of Engineers Waterborne Commerce Statistics Center was used to identify the top 25 ports.
www.maritimelogisticsprofessional.com 47
I