Page 46: of Maritime Logistics Professional Magazine (Mar/Apr 2019)
Container Ports
Read this page in Pdf, Flash or Html5 edition of Mar/Apr 2019 Maritime Logistics Professional Magazine
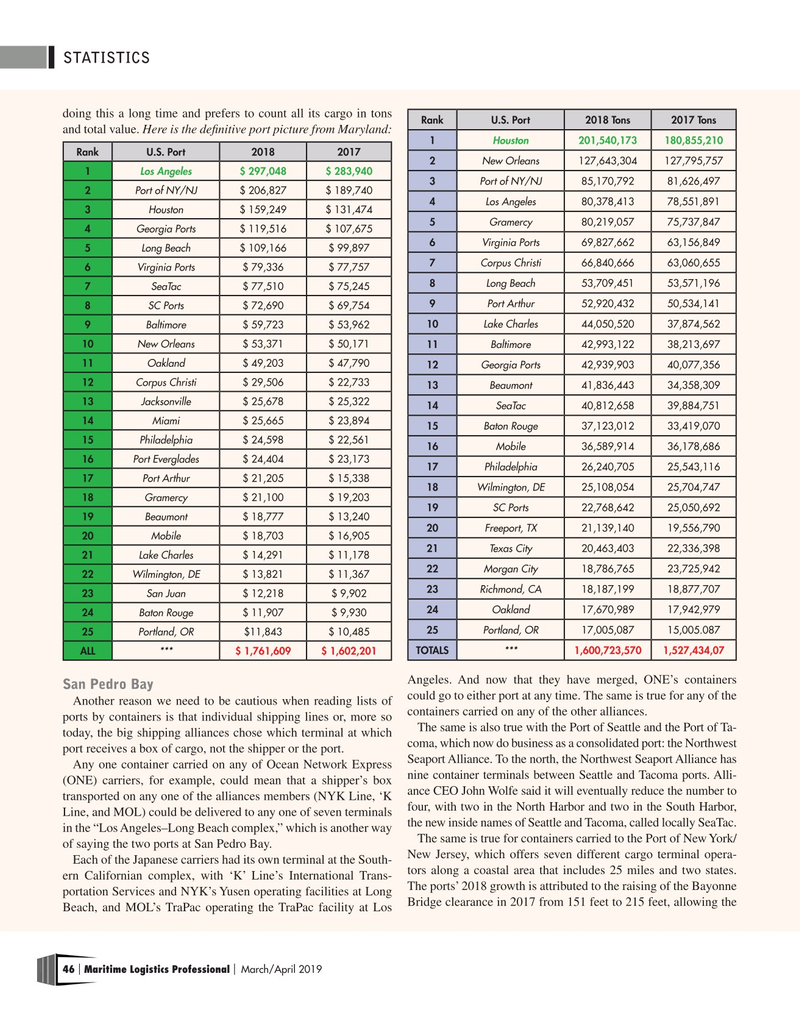
STATISTICS doing this a long time and prefers to count all its cargo in tons
RankU.S. Port2018 Tons2017 Tons and total value. Here is the de?nitive port picture from Maryland: 1 Houston 201,540,173180,855,210
RankU.S. Port20182017 2 New Orleans 127,643,304127,795,757 1 Los Angeles $ 297,048$ 283,940 3 Port of NY/NJ 85,170,79281,626,497 2 Port of NY/NJ $ 206,827$ 189,740 4 Los Angeles 80,378,41378,551,891 3 Houston $ 159,249$ 131,474 5 Gramercy 80,219,05775,737,847 4 Georgia Ports $ 119,516$ 107,675 6 Virginia Ports 69,827,66263,156,849 5 Long Beach $ 109,166$ 99,897 7 Corpus Christi 66,840,66663,060,655 6 Virginia Ports $ 79,336$ 77,757 8 Long Beach 53,709,45153,571,196 7 SeaTac $ 77,510$ 75,245 9 Port Arthur 52,920,43250,534,141 8 SC Ports $ 72,690$ 69,754 9 Baltimore $ 59,723$ 53,962 10 Lake Charles 44,050,52037,874,562 10 New Orleans $ 53,371$ 50,171 11 Baltimore 42,993,12238,213,697 11 Oakland $ 49,203$ 47,790 12 Georgia Ports 42,939,90340,077,356 12 Corpus Christi $ 29,506$ 22,733 13 Beaumont 41,836,44334,358,309 13 Jacksonville $ 25,678$ 25,322 14 SeaTac 40,812,65839,884,751 14 Miami $ 25,665$ 23,894 15 Baton Rouge 37,123,01233,419,070 15 Philadelphia $ 24,598$ 22,561 16 Mobile 36,589,91436,178,686 16 Port Everglades $ 24,404$ 23,173 17 Philadelphia 26,240,70525,543,116 17 Port Arthur $ 21,205$ 15,338 18 Wilmington, DE 25,108,05425,704,747 18 Gramercy $ 21,100$ 19,203 19 SC Ports 22,768,64225,050,692 19 Beaumont $ 18,777$ 13,240 20 Freeport, TX 21,139,14019,556,790 20 Mobile $ 18,703$ 16,905 21 Texas City 20,463,40322,336,398 21 Lake Charles $ 14,291$ 11,178 22 Morgan City 18,786,76523,725,942 22 Wilmington, DE $ 13,821$ 11,367 23 Richmond, CA 18,187,19918,877,707 23 San Juan $ 12,218$ 9,902 24 Oakland 17,670,98917,942,979 24 Baton Rouge $ 11,907$ 9,930 25 Portland, OR 17,005,08715,005.087 25 Portland, OR $11,843$ 10,485
ALL *** $ 1,761,609$ 1,602,201 TOTALS *** 1,600,723,5701,527,434,07
Angeles. And now that they have merged, ONE’s containers
San Pedro Bay
Another reason we need to be cautious when reading lists of could go to either port at any time. The same is true for any of the ports by containers is that individual shipping lines or, more so containers carried on any of the other alliances.
The same is also true with the Port of Seattle and the Port of Ta- today, the big shipping alliances chose which terminal at which coma, which now do business as a consolidated port: the Northwest port receives a box of cargo, not the shipper or the port.
Any one container carried on any of Ocean Network Express Seaport Alliance. To the north, the Northwest Seaport Alliance has (ONE) carriers, for example, could mean that a shipper’s box nine container terminals between Seattle and Tacoma ports. Alli- ance CEO John Wolfe said it will eventually reduce the number to transported on any one of the alliances members (NYK Line, ‘K four, with two in the North Harbor and two in the South Harbor,
Line, and MOL) could be delivered to any one of seven terminals the new inside names of Seattle and Tacoma, called locally SeaTac.
in the “Los Angeles–Long Beach complex,” which is another way
The same is true for containers carried to the Port of New York/ of saying the two ports at San Pedro Bay.
New Jersey, which offers seven different cargo terminal opera-
Each of the Japanese carriers had its own terminal at the South- tors along a coastal area that includes 25 miles and two states. ern Californian complex, with ‘K’ Line’s International Trans-
The ports’ 2018 growth is attributed to the raising of the Bayonne portation Services and NYK’s Yusen operating facilities at Long
Beach, and MOL’s TraPac operating the TraPac facility at Los Bridge clearance in 2017 from 151 feet to 215 feet, allowing the 46 Maritime Logistics Professional March/April 2019 | |

 45
45

 47
47
