Page 45: of Maritime Logistics Professional Magazine (Mar/Apr 2019)
Container Ports
Read this page in Pdf, Flash or Html5 edition of Mar/Apr 2019 Maritime Logistics Professional Magazine
 44
44
 46
46
STATISTICS
T T 25 P 2018 HE OP ORTS IN veryone who likes a simple view loves a list. Top ?ve scrub- NOLA’s containerized cargo to record levels. In addition, loaded bers, top 10 cities, top 15 funny movies, top 20 ports. And imported containers rose 7 percent, which continues to be a fo-
Eso last year at this time we provided a list of the top 10 U.S. cus of Port NOLA’s marketing efforts,” said Brandy D. Christian,
Ports by TEUs and value. That information was provided to us by Port NOLA President and CEO. “We anticipate further growth, as the diligent folks at Descartes Datamine, one of the best maritime direct all-water carrier services to Asia, Europe and the Mediter- data crunchers on the planet. ranean attract larger vessels.”
Notably, the top 10 ports are the same for 2018. But the actual Houston, number one in the U.S. in foreign tonnage and just numbers for 2018 are larger, just as the numbers for 2017 are ahead of New Orleans in total foreign tonnage, still aspires to top vastly larger because Descartes counts only loaded inbound con- container port designation. At the end of August last year it could tainers, not all containers. So, the number of outbound containers ?nally and truthfully make the claim: “Houston Jumps To Top 5 in Los Angeles for 2017 was 1,900,000, and the number of empty U.S. Container Ports.” containers handled in LA totaled 2,227,200; both were not count- The port of Houston release said, “Due to continued strong growth ed in the Descartes survey. That’s just the way they do things. in loaded containerized cargo, Port Houston has surged higher in
This is but one reason the exercise of counting containers, the rankings of the top container ports in the United States. Port
TEUs, (Twenty-foot equivalency units) handled by each port each Houston, which has been expanding rapidly in recent years, has year has become relatively meaningless, except to those ports who climbed to become the ?fth largest container port in the U.S., ac- wish to, or need to, show some measure of growth. Unless you cording to JOC Piers data covering the second quarter of 2018. Port can count all TEUs plus the additional millions of tons of other Houston handled 1,057,964 twenty-foot-equivalent-units (TEUs) cargo and its relative value, you are only getting part of the story. during that period and catapulted up from the sixth spot.”
It added, “Port Houston is No. 1 in the U.S. in foreign tonnage
Those Who Aspire and is now is in the Top 5 for containers with Los Angeles, New “The Port of New Orleans (Port NOLA) moved more contain- York, Savannah and Long Beach. Houston continues to close the ers in 2018 than at any time in its history, totaling 591,253 twen- gap. Port Houston is the largest container port in the U.S. Gulf of ty-foot equivalent units (TEUs), up 12.3 percent compared to one Mexico, handling about two-thirds of all the containers that move year ago. The record marks the ?fth year in a row Port NOLA through the Gulf,” it added.
has surpassed the half million TEU-mark at its Napoleon Avenue In the 2018 time period Houston was ?rst in the nation in terms
Container Terminal, which is operated by New Orleans Terminal of total cargo tonnage and third in total cargo value, far ahead of and Ports America,” according to the port’s president. second place New Orleans in total tonnage and second place Port “The expansion of the Panama Canal and growth in container- of New York, New Jersey in terms of cargo value, according to a ized exports, namely resin and frozen poultry, have buoyed Port study conducted by the Maryland Port Authority which has been
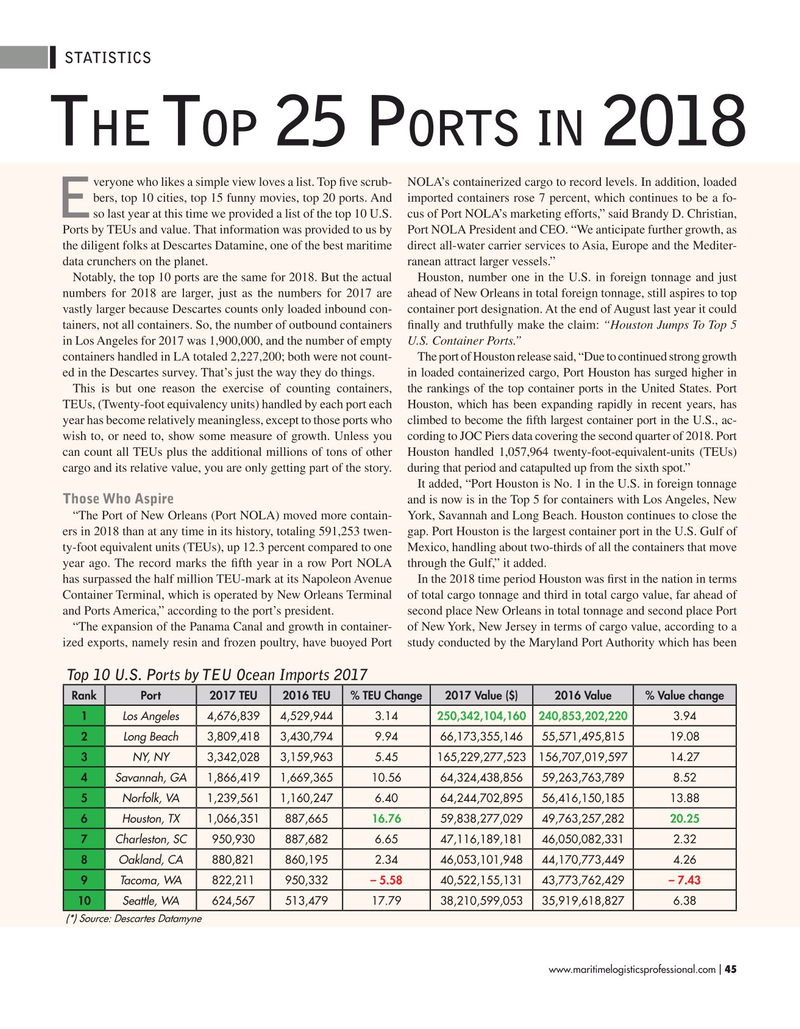
Top 10 U.S. Ports by TEU Ocean Imports 2017
RankPort2017 TEU2016 TEU% TEU Change2017 Value ($)2016 Value% Value change 1 Los Angeles 4,676,8394,529,9443.14 250,342,104,160240,853,202,220 3.94 2 Long Beach 3,809,4183,430,7949.9466,173,355,14655,571,495,81519.08 3 NY, NY 3,342,0283,159,9635.45165,229,277,523156,707,019,59714.27 4 Savannah, GA 1,866,4191,669,36510.5664,324,438,85659,263,763,7898.52 5 Norfolk, VA 1,239,5611,160,2476.4064,244,702,89556,416,150,18513.88 6 Houston, TX 1,066,351887,665 16.76 59,838,277,02949,763,257,282 20.25 7 Charleston, SC 950,930887,6826.6547,116,189,18146,050,082,3312.32 8 Oakland, CA 880,821860,1952.3446,053,101,94844,170,773,4494.26 9 Tacoma, WA 822,211950,332 – 5.58 40,522,155,13143,773,762,429 – 7.43 10 Seattle, WA 624,567513,47917.7938,210,599,05335,919,618,8276.38 (*) Source: Descartes Datamyne www.maritimelogisticsprofessional.com 45
I