Page 41: of Marine News Magazine (December 2010)
Great Ships of 2010
Read this page in Pdf, Flash or Html5 edition of December 2010 Marine News Magazine
 40
40
 42
42
www.marinelink.com MN 41
Offshore Rig Day Rates
Floating Rigs
Rig Type Rigs Working Total Rig Fleet Average Day Rate
Drillship < 4000' WD 6 rigs 8 rigs $257,120.00
Drillship 4000'+ WD 35 rigs 48 rigs $422,089.65
Semisub < 1500' WD 11 rigs 18 rigs $293,992.86
Semisub 1500'+ WD 62 rigs 86 rigs $316,463.40
Semisub 4000'+ WD 77 rigs 91 rigs $403,129.75
Jackup Rigs
Rig Type Rigs Working Total Rig Fleet Average Day Rate
Jackup IC < 250' WD 32 rigs 52 rigs $82,450.00
Jackup IC 250' WD 40 rigs 65 rigs $95,251.56
Jackup IC 300' WD 88 rigs 125 rigs $104,296.67
Jackup IC 300'+ WD 110 rigs 144 rigs $139,466.00
Jackup IS < 250' WD 5 rigs 7 rigs —
Jackup IS 250' WD 8 rigs 10 rigs $137,000.00
Jackup IS 300' WD 2 rigs 5 rigs $60,300.00
Jackup IS 300'+ WD 0 rigs 3 rigs —
Jackup MC < 200' WD 2 rigs 16 rigs $33,000.00
Jackup MC 200'+ WD 9 rigs 28 rigs $52,333.33
Jackup MS < 200' WD 2 rigs 2 rigs —
Jackup MS 200'+ WD 6 rigs 19 rigs $68,250.00
Other Offshore Rigs
Rig Type Rigs Working Total Rig Fleet Average Day Rate
Drill Barge < 150' WD 18 rigs 39 rigs —
Drill Barge 150'+ WD 5 rigs 9 rigs —
Inland Barge 39 rigs 74 rigs $51,157.14
Platform Rig 142 rigs 250 rigs $44,996.43
Submersible 0 rigs 6 rigs —
Tender 23 rigs 32 rigs $122,806.67
Source: Rigzone
Offshore Rig Fleet by Region
Region % No.
Africa – West 88.5% (46/52)
Asia – SouthEast 76.4% (68/89)
Europe - North Sea 83.6% (61/73)
Mediterranean 71.4% (15/21)
MidEast - Persian Gulf 74.5% (73/98)
N. America – Mexico 68.8% (22/32)
N. America - US GOM 68.4% (54/79)
S. America – Brazil 91.8% (56/61)
Source: Rigzone
Offshore Rig Utilization by Type
Type % No.
Drill Barge 80.0% (8/10)
Drillship 77.8% (42/54)
Jackup 73.9% (269/364)
Semisub 86.3% (145/168)
Tender 82.8% (25/29)
Source: Rigzone
Bunker Fuel
Port IFO 380 IFO 180 MDO Del. Date
Corpus Christi 485.00 510.00 765.00 D 2010-11-18
Houston 456.00 478.00 — W 2010-11-17
Source: BunkerIndex.com - http://www.bunkerworld.com/markets/prices
Port IFO380 IFO180 MGO MDO Barge Updated
New York 472.50 498.50 — 739.00 $7.50 Nov 17
Houston 460.00 481.50 — 742.50 $7.00 Nov 18
Los Angeles 490.00 510.50 Pending Pending $5.80 Nov 18
Source: Bunkerworld.com - http://www.bunkerworld.com/markets/surcharges/tsa#
TSA Surcharge
West Coast
Date $/MT ch/$ ch/%
Nov 15 489.00 -11.50 -2.3
Nov 8 500.50 +23.00 +4.8
Nov 1 477.50 +1.00 +0.2
Oct 25 476.50 +10.00 +2.1
Oct 18 466.50 -8.50 -1.8
Oct 11 475.00 +6.00 +1.3
Oct 4 469.00 +20.00 +4.5
Sep 27 449.00 +20.00 +4.5
Sep 20 452.50 -1.50 -0.3
Sep 13 454.00 -2.00 -0.4
Sep 6 456.00 +12.50 +2.8
Aug 30 443.50 +1.00 +0.2
East Coast
Date $/MT ch/$ ch/%
Nov 15 497.00 -2.00 -0.4
Nov 8 499.00 +21.00 +4.4
Nov 1 478.00 +1.00 +0.2
Oct 25 477.00 +5.50 +1.2
Oct 18 471.50 -11.00 -2.3
Oct 11 482.50 +8.50 +1.8
Oct 4 474.00 +19.00 +4.2
Sep 27 455.00 -4.00 -0.9
Sep 20 459.00 -1.00 -0.2
Sep 13 460.00 +1.50 +0.3
Sep 6 458.50 +4.00 +0.9
Aug 30 454.50 +6.00 +1.3
Source: Bunkerworld.com http://www.bunkerworld.com/markets/surcharges/tsa#
Indicative World Steel Prices
Indicative prices Change
SBB HRC world price $/t 661.89 -18
SBB Rebar world price $/t 632.558 +1
SBB World Price Tracker 231.744 -3
Source: Steel Business Briefing http://www.steelbb.com/steelprices/
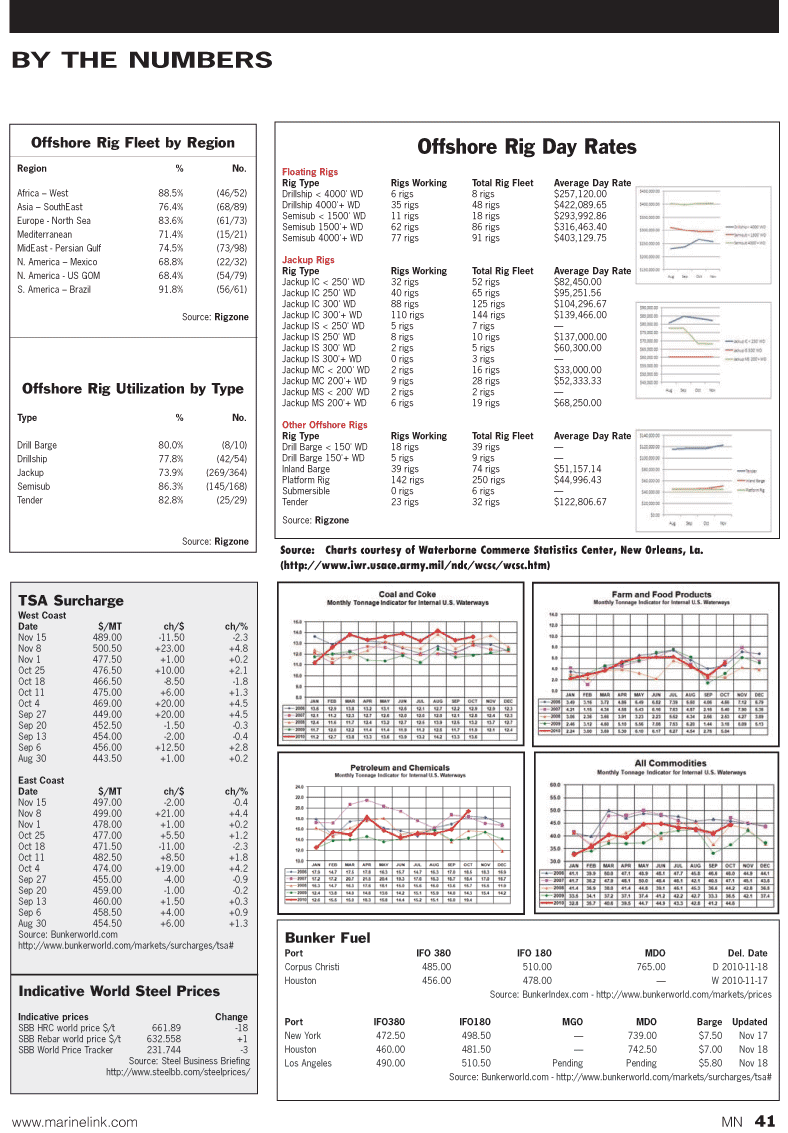
Source: Charts courtesy of Waterborne Commerce Statistics Center, New Orleans, La. (http://www.iwr.usace.army.mil/ndc/wcsc/wcsc.htm)
BY THE NUMBERS