Page 57: of Marine News Magazine (May 2011)
Combat Craft Annual
Read this page in Pdf, Flash or Html5 edition of May 2011 Marine News Magazine
 56
56
 58
58
www.marinelink.com MN 57
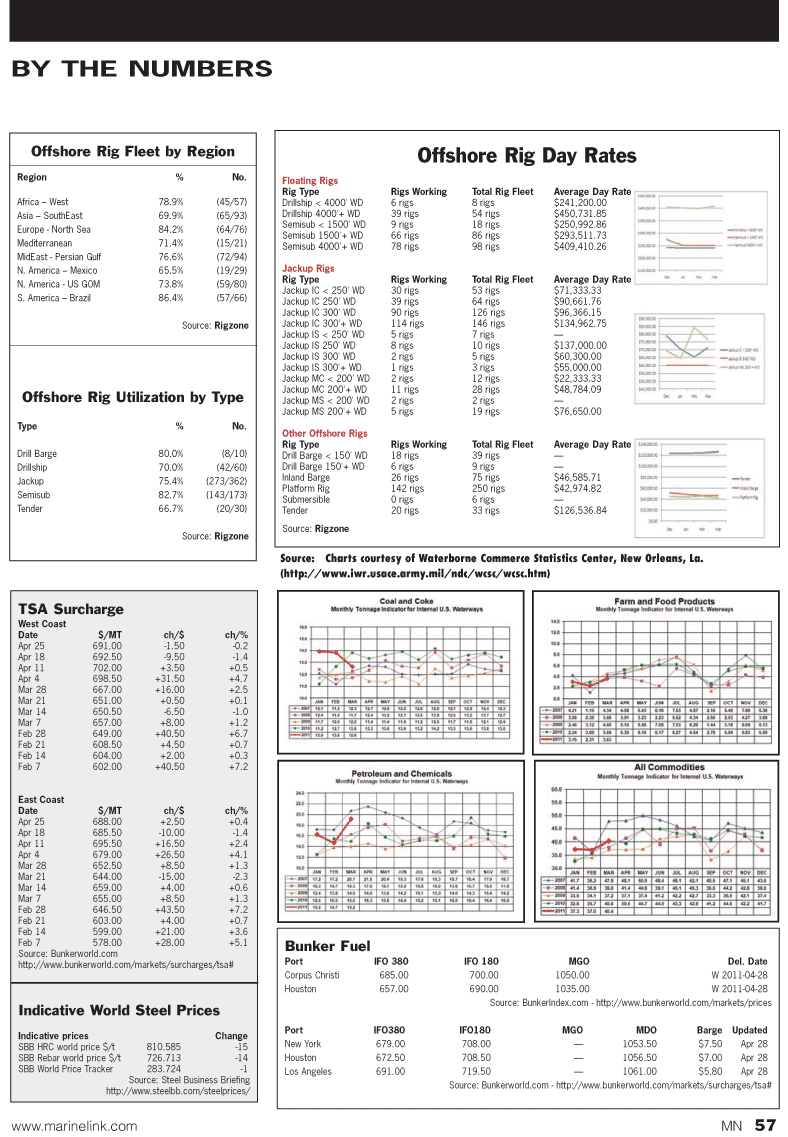
Offshore Rig Day Rates
Floating Rigs
Rig Type Rigs Working Total Rig Fleet Average Day Rate
Drillship < 4000' WD 6 rigs 8 rigs $241,200.00
Drillship 4000'+ WD 39 rigs 54 rigs $450,731.85
Semisub < 1500' WD 9 rigs 18 rigs $250,992.86
Semisub 1500'+ WD 66 rigs 86 rigs $293,511.73
Semisub 4000'+ WD 78 rigs 98 rigs $409,410.26
Jackup Rigs
Rig Type Rigs Working Total Rig Fleet Average Day Rate
Jackup IC < 250' WD 30 rigs 53 rigs $71,333.33
Jackup IC 250' WD 39 rigs 64 rigs $90,661.76
Jackup IC 300' WD 90 rigs 126 rigs $96,366.15
Jackup IC 300'+ WD 114 rigs 146 rigs $134,962.75
Jackup IS < 250' WD 5 rigs 7 rigs —
Jackup IS 250' WD 8 rigs 10 rigs $137,000.00
Jackup IS 300' WD 2 rigs 5 rigs $60,300.00
Jackup IS 300'+ WD 1 rigs 3 rigs $55,000.00
Jackup MC < 200' WD 2 rigs 12 rigs $22,333.33
Jackup MC 200'+ WD 11 rigs 28 rigs $48,784.09
Jackup MS < 200' WD 2 rigs 2 rigs —
Jackup MS 200'+ WD 5 rigs 19 rigs $76,650.00
Other Offshore Rigs
Rig Type Rigs Working Total Rig Fleet Average Day Rate
Drill Barge < 150' WD 18 rigs 39 rigs —
Drill Barge 150'+ WD 6 rigs 9 rigs —
Inland Barge 26 rigs 75 rigs $46,585.71
Platform Rig 142 rigs 250 rigs $42,974.82
Submersible 0 rigs 6 rigs —
Tender 20 rigs 33 rigs $126,536.84
Source: Rigzone
Offshore Rig Fleet by Region
Region % No.
Africa – West 78.9% (45/57)
Asia – SouthEast 69.9% (65/93)
Europe - North Sea 84.2% (64/76)
Mediterranean 71.4% (15/21)
MidEast - Persian Gulf 76.6% (72/94)
N. America – Mexico 65.5% (19/29)
N. America - US GOM 73.8% (59/80)
S. America – Brazil 86.4% (57/66)
Source: Rigzone
Offshore Rig Utilization by Type
Type % No.
Drill Barge 80.0% (8/10)
Drillship 70.0% (42/60)
Jackup 75.4% (273/362)
Semisub 82.7% (143/173)
Tender 66.7% (20/30)
Source: Rigzone
Bunker Fuel
Port IFO 380 IFO 180 MGO Del. Date
Corpus Christi 685.00 700.00 1050.00 W 2011-04-28
Houston 657.00 690.00 1035.00 W 2011-04-28
Source: BunkerIndex.com - http://www.bunkerworld.com/markets/prices
Port IFO380 IFO180 MGO MDO Barge Updated
New York 679.00 708.00 — 1053.50 $7.50 Apr 28
Houston 672.50 708.50 — 1056.50 $7.00 Apr 28
Los Angeles 691.00 719.50 — 1061.00 $5.80 Apr 28
Source: Bunkerworld.com - http://www.bunkerworld.com/markets/surcharges/tsa#
TSA Surcharge
West Coast
Date $/MT ch/$ ch/%
Apr 25 691.00 -1.50 -0.2
Apr 18 692.50 -9.50 -1.4
Apr 11 702.00 +3.50 +0.5
Apr 4 698.50 +31.50 +4.7
Mar 28 667.00 +16.00 +2.5
Mar 21 651.00 +0.50 +0.1
Mar 14 650.50 -6.50 -1.0
Mar 7 657.00 +8.00 +1.2
Feb 28 649.00 +40.50 +6.7
Feb 21 608.50 +4.50 +0.7
Feb 14 604.00 +2.00 +0.3
Feb 7 602.00 +40.50 +7.2
East Coast
Date $/MT ch/$ ch/%
Apr 25 688.00 +2.50 +0.4
Apr 18 685.50 -10.00 -1.4
Apr 11 695.50 +16.50 +2.4
Apr 4 679.00 +26.50 +4.1
Mar 28 652.50 +8.50 +1.3
Mar 21 644.00 -15.00 -2.3
Mar 14 659.00 +4.00 +0.6
Mar 7 655.00 +8.50 +1.3
Feb 28 646.50 +43.50 +7.2
Feb 21 603.00 +4.00 +0.7
Feb 14 599.00 +21.00 +3.6
Feb 7 578.00 +28.00 +5.1
Source: Bunkerworld.com http://www.bunkerworld.com/markets/surcharges/tsa#
Indicative World Steel Prices
Indicative prices Change
SBB HRC world price $/t 810.585 -15
SBB Rebar world price $/t 726.713 -14
SBB World Price Tracker 283.724 -1
Source: Steel Business Briefing http://www.steelbb.com/steelprices/
Source: Charts courtesy of Waterborne Commerce Statistics Center, New Orleans, La. (http://www.iwr.usace.army.mil/ndc/wcsc/wcsc.htm)
BY THE NUMBERS