Page 8: of Marine News Magazine (March 2012)
Training & Education
Read this page in Pdf, Flash or Html5 edition of March 2012 Marine News Magazine
 7
7
 9
9
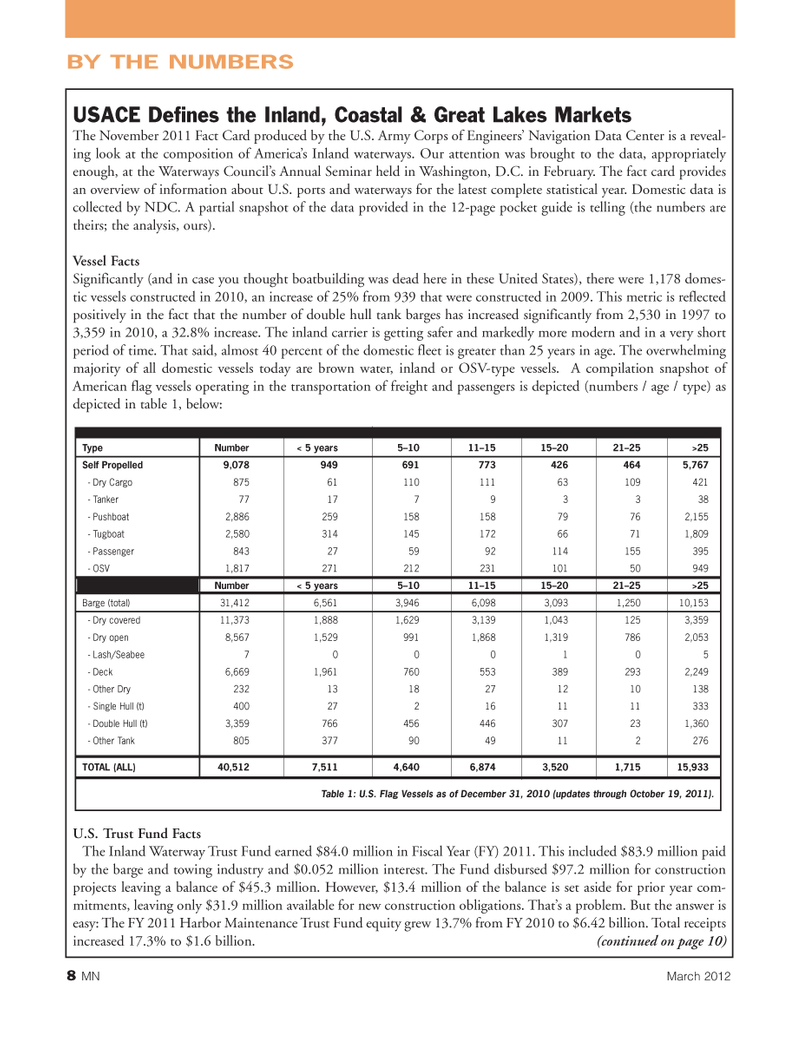
8MNMarch 2012 BY THE NUMBERS USACE Defines the Inland, Coastal & Great Lakes Markets The November 2011 Fact Card produced by the U.S. Army Corps of Engineers? Navigation Data Center is a reveal- ing look at the composition of America?s Inland waterways. Our attention was brought to the data, appropriately enough, at the Waterways Council?s Annual Seminar held in Washington, D.C. in February. The fact card provides an overview of information about U.S. ports and waterways for the latest complete statistical year. Domestic data is collected by NDC. A partial snapshot of the data provided in the 12-page pocket guide is telling (the numbers are theirs; the analysis, ours).Vessel Facts Significantly (and in case you thought boatbuilding was dead here in these United States), there were 1,178 domes- tic vessels constructed in 2010, an increase of 25% from 939 that were constructed in 2009. This metric is reflected positively in the fact that the number of double hull tank barges has increased significantly from 2,530 in 1997 to 3,359 in 2010, a 32.8% increase. The inland carrier is getting safer and markedly more modern and in a very short period of time. That said, almost 40 percent of the domestic fleet is greater than 25 years in age. The overwhelming majority of all domestic vessels today are brown water, inland or OSV-type vessels. A compilation snapshot of American flag vessels operating in the transportation of freight and passengers is depicted (numbers / age / type) as depicted in table 1, below: U.S. Trust Fund Facts The Inland Waterway Trust Fund earned $84.0 million in Fiscal Year (FY) 2011. This included $83.9 million paid by the barge and towing industry and $0.052 million interest. The Fund disbursed $97.2 million for construction projects leaving a balance of $45.3 million. However, $13.4 million of the balance is set aside for prior year com- mitments, leaving only $31.9 million available for new construction obligations. That?s a problem. But the answer is easy: The FY 2011 Harbor Maintenance Trust Fund equity grew 13.7% from FY 2010 to $6.42 billion. Total receipts increased 17.3% to $1.6 billion. (continued on page 10)Type Number< 5 years5?1011?1515?2021?25 >25Self Propelled 9,0789496917734264645,767 - Dry Cargo 8756111011163109421- Tanker 7717793338- Pushboat2,88625915815879762,155 - Tugboat 2,58031414517266711,809 - Passenger843275992114155395- OSV1,81727121223110150949Number< 5 years5?1011?1515?2021?25 >25Barge (total) 31,4126,5613,9466,0983,0931,25010,153 - Dry covered 11,3731,8881,6293,1391,0431253,359 - Dry open8,5671,5299911,8681,3197862,053 - Lash/Seabee7000105- Deck6,6691,9617605533892932,249 - Other Dry2321318271210138- Single Hull (t)400272161111333- Double Hull (t)3,359766456446307231,360 - Other Tank 8053779049112276TOTAL (ALL) 40,5127,5114,6406,8743,5201,71515,933 Table 1: U.S. Flag Vessels as of December 31, 2010 (updates through October 19, 2011). MN#3 (1-17):MN 2011 Layouts 3/5/2012 1:36 PM Page 8