Page 14: of Marine News Magazine (July 2012)
Propulsion Technology
Read this page in Pdf, Flash or Html5 edition of July 2012 Marine News Magazine
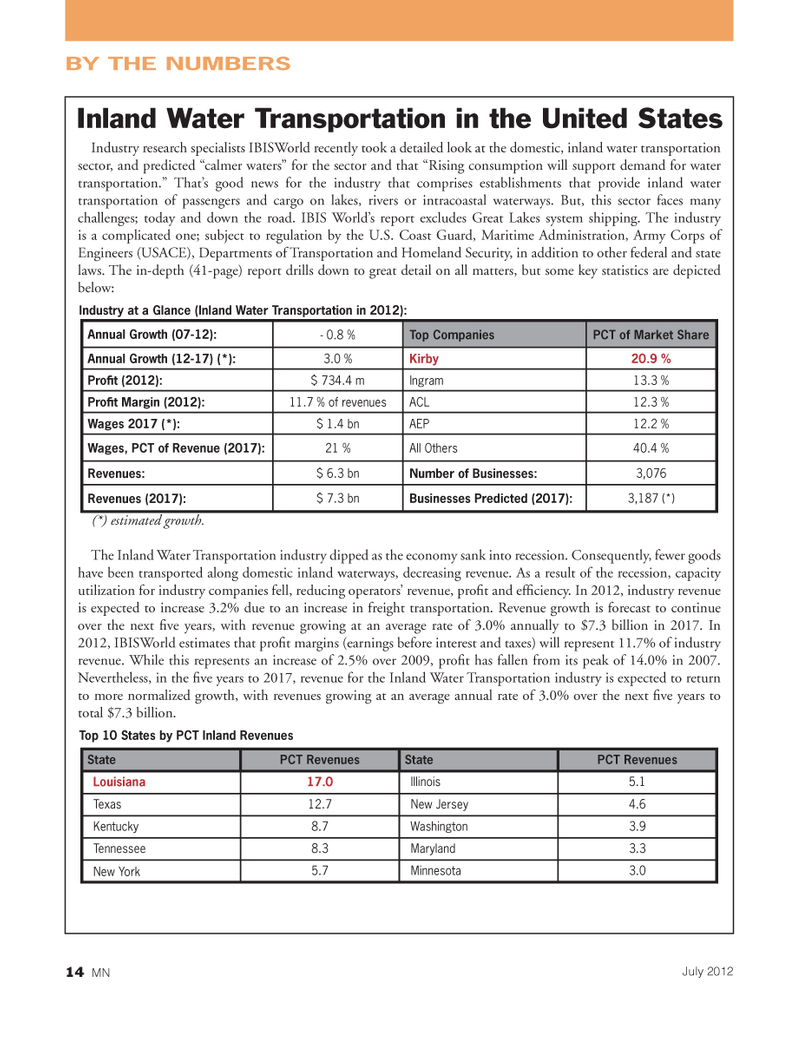
Industry research specialists IBISWorld recently took a detailed look at the domestic, inland water transportation sector, and predicted ?calmer waters? for the sector and that ?Rising consumption will support demand for water transportation.? That?s good news for the industry that comprises establishments that provide inland water transportation of passengers and cargo on lakes, rivers or intracoastal waterways. But, this sector faces many challenges; today and down the road. IBIS World?s report excludes Great Lakes system shipping. The industry is a complicated one; subject to regulation by the U.S. Coast Guard, Maritime Administration, Army Corps of Engineers (USACE), Departments of Transportation and Homeland Security, in addition to other federal and state laws. The in-depth (41-page) report drills down to great detail on all matters, but some key statistics are depicted below: Industry at a Glance (Inland Water Transportation in 2012): (*) estimated growth. The Inland Water Transportation industry dipped as the economy sank into recession. Consequently, fewer goods have been transported along domestic inland waterways, decreasing revenue. As a result of the recession, capacity utilization for industry companies fell, reducing operators? revenue, pro t and ef ciency. In 2012, industry revenue is expected to increase 3.2% due to an increase in freight transportation. Revenue growth is forecast to continue over the next ve years, with revenue growing at an average rate of 3.0% annually to $7.3 billion in 2017. In 2012, IBISWorld estimates that pro t margins (earnings before interest and taxes) will represent 11.7% of industry revenue. While this represents an increase of 2.5% over 2009, pro t has fallen from its peak of 14.0% in 2007. Nevertheless, in the ve years to 2017, revenue for the Inland Water Transportation industry is expected to return to more normalized growth, with revenues growing at an average annual rate of 3.0% over the next ve years to total $7.3 billion. Top 10 States by PCT Inland Revenues BY THE NUMBERSInland Water Transportation in the United States Annual Growth (07-12): - 0.8 %Top CompaniesPCT of Market Share Annual Growth (12-17) (*): 3.0 %Kirby20.9 %ProÞ t (2012): $ 734.4 mIngram13.3 % ProÞ t Margin (2012): 11.7 % of revenuesACL 12.3 %Wages 2017 (*): $ 1.4 bnAEP 12.2 %Wages, PCT of Revenue (2017): 21 %All Others 40.4 %Revenues:$ 6.3 bnNumber of Businesses:3,076Revenues (2017):$ 7.3 bnBusinesses Predicted (2017): 3,187 (*)StatePCT RevenuesState PCT RevenuesLouisiana17.0Illinois5.1Texas12.7New Jersey4.6Kentucky8.7Washington 3.9Tennessee 8.3Maryland3.3New York 5.7Minnesota3.0 14 MNJuly 2012

 13
13

 15
15
