Page 8: of Marine News Magazine (July 2013)
Propulsion Technology
Read this page in Pdf, Flash or Html5 edition of July 2013 Marine News Magazine
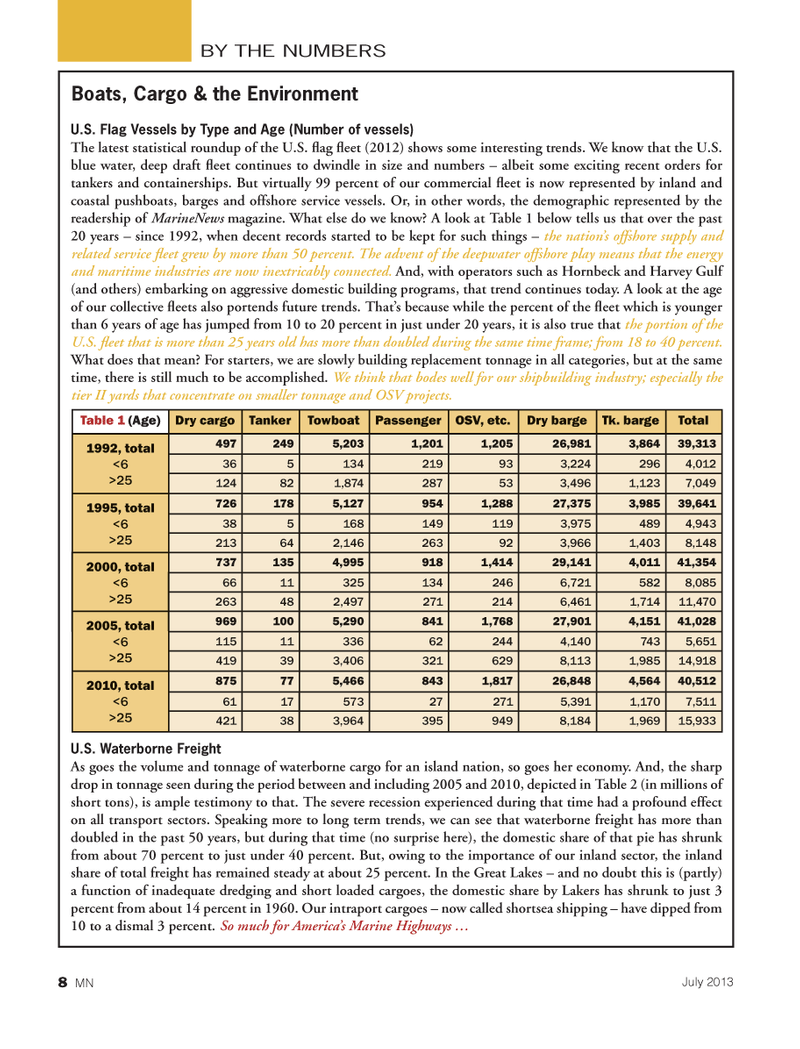
U.S. Flag Vessels by Type and Age (Number of vessels) The latest statistical roundup of the U.S. ? ag ? eet (2012) shows some interesting trends. We know that the U.S. blue water, deep draft ? eet continues to dwindle in size and numbers ? albeit some exciting recent orders for tankers and containerships. But virtually 99 percent of our commercial ? eet is now represented by inland and coastal pushboats, barges and offshore service vessels. Or, in other words, the demographic represented by the readership of MarineNews magazine. What else do we know? A look at Table 1 below tells us that over the past 20 years ? since 1992, when decent records started to be kept for such things ? the nations offshore supply and related service ? eet grew by more than 50 percent. The advent of the deepwater offshore play means that the energy and maritime industries are now inextricably connected. And, with operators such as Hornbeck and Harvey Gulf (and others) embarking on aggressive domestic building programs, that trend continues today. A look at the age of our collective ? eets also portends future trends. Thats because while the percent of the ? eet which is younger than 6 years of age has jumped from 10 to 20 percent in just under 20 years, it is also true that the portion of the U.S. ? eet that is more than 25 years old has more than doubled during the same time frame; from 18 to 40 percent. What does that mean? For starters, we are slowly building replacement tonnage in all categories, but at the same time, there is still much to be accomplished. We think that bodes well for our shipbuilding industry; especially the tier II yards that concentrate on smaller tonnage and OSV projects. U.S. Waterborne Freight As goes the volume and tonnage of waterborne cargo for an island nation, so goes her economy. And, the sharp drop in tonnage seen during the period between and including 2005 and 2010, depicted in Table 2 (in millions of short tons), is ample testimony to that. The severe recession experienced during that time had a profound effect on all transport sectors. Speaking more to long term trends, we can see that waterborne freight has more than doubled in the past 50 years, but during that time (no surprise here), the domestic share of that pie has shrunk from about 70 percent to just under 40 percent. But, owing to the importance of our inland sector, the inland share of total freight has remained steady at about 25 percent. In the Great Lakes ? and no doubt this is (partly) a function of inadequate dredging and short loaded cargoes, the domestic share by Lakers has shrunk to just 3 percent from about 14 percent in 1960. Our intraport cargoes ? now called shortsea shipping ? have dipped from 10 to a dismal 3 percent. So much for Americas Marine Highways ? Table 1 (Age)Dry cargoTankerTowboatPassengerOSV, etc.Dry bargeTk. bargeTotal 1992, total<6>254972495,2031,2011,20526,9813,86439,313 365134219933,2242964,012 124821,874287533,4961,1237,049 1995, total <6>257261785,1279541,28827,3753,98539,641 3851681491193,9754894,943 213642,146263923,9661,4038,148 2000, total <6>257371354,9959181,41429,1414,01141,354 66113251342466,7215828,085 263482,4972712146,4611,71411,470 2005, total <6>259691005,2908411,76827,9014,15141,028 11511336 622444,1407435,651 419393,4063216298,1131,98514,918 2010, total <6>25875775,4668431,81726,8484,56440,512 6117573272715,3911,1707,511 421383,9643959498,1841,96915,933 BY THE NUMBERSBoats, Cargo & the Environment 8 MNJuly 2013MN July2013 Layout 1-17.indd 86/27/2013 12:58:01 PM

 7
7

 9
9
