
Page 8: of Marine News Magazine (October 2013)
Manning: Recruitment & Retention
Read this page in Pdf, Flash or Html5 edition of October 2013 Marine News Magazine
 7
7
 9
9
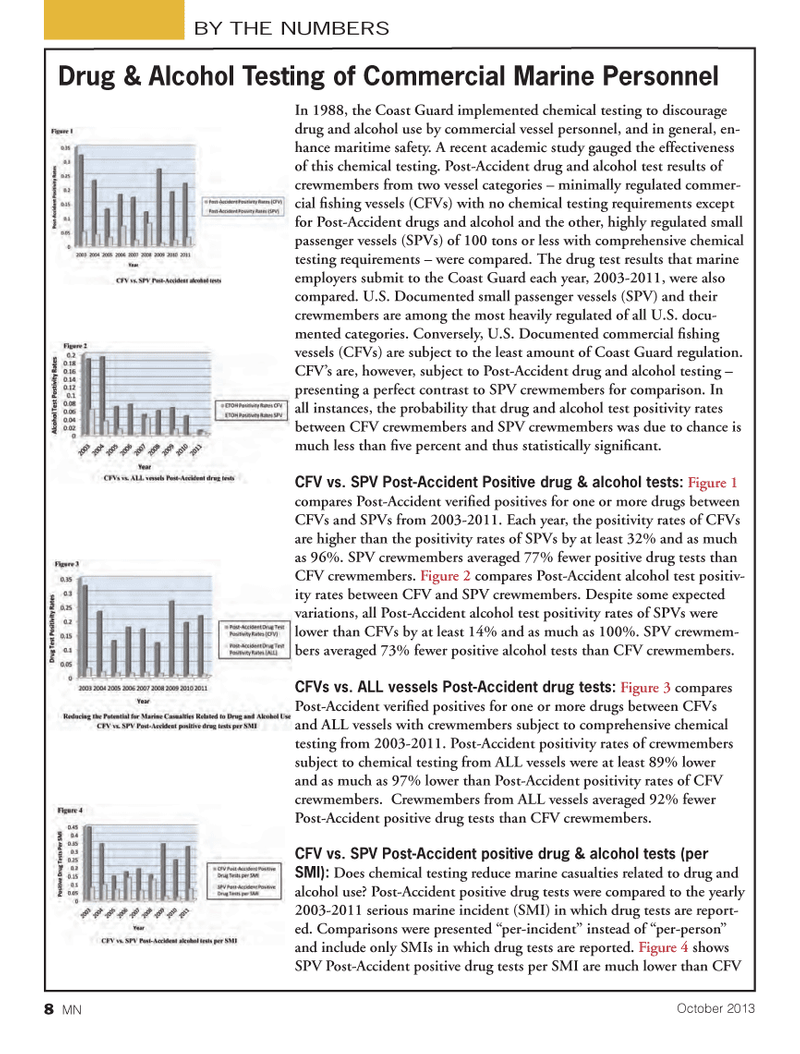
In 1988, the Coast Guard implemented chemical testing to discourage drug and alcohol use by commercial vessel personnel, and in general, en- hance maritime safety. A recent academic study gauged the effectiveness of this chemical testing. Post-Accident drug and alcohol test results of crewmembers from two vessel categories ? minimally regulated commer- cial shing vessels (CFVs) with no chemical testing requirements except for Post-Accident drugs and alcohol and the other, highly regulated small passenger vessels (SPVs) of 100 tons or less with comprehensive chemical testing requirements ? were compared. The drug test results that marine employers submit to the Coast Guard each year, 2003-2011, were also compared. U.S. Documented small passenger vessels (SPV) and their crewmembers are among the most heavily regulated of all U.S. docu- mented categories. Conversely, U.S. Documented commercial shing vessels (CFVs) are subject to the least amount of Coast Guard regulation. CFV?s are, however, subject to Post-Accident drug and alcohol testing ? presenting a perfect contrast to SPV crewmembers for comparison. In all instances, the probability that drug and alcohol test positivity rates between CFV crewmembers and SPV crewmembers was due to chance is much less than ve percent and thus statistically signi cant. CFV vs. SPV Post-Accident Positive drug & alcohol tests: Figure 1 compares Post-Accident veri ed positives for one or more drugs between CFVs and SPVs from 2003-2011. Each year, the positivity rates of CFVs are higher than the positivity rates of SPVs by at least 32% and as much as 96%. SPV crewmembers averaged 77% fewer positive drug tests than CFV crewmembers. Figure 2 compares Post-Accident alcohol test positiv- ity rates between CFV and SPV crewmembers. Despite some expected variations, all Post-Accident alcohol test positivity rates of SPVs were lower than CFVs by at least 14% and as much as 100%. SPV crewmem- bers averaged 73% fewer positive alcohol tests than CFV crewmembers. CFVs vs. ALL vessels Post-Accident drug tests: Figure 3 compares Post-Accident veri ed positives for one or more drugs between CFVs and ALL vessels with crewmembers subject to comprehensive chemical testing from 2003-2011. Post-Accident positivity rates of crewmembers subject to chemical testing from ALL vessels were at least 89% lower and as much as 97% lower than Post-Accident positivity rates of CFV crewmembers. Crewmembers from ALL vessels averaged 92% fewer Post-Accident positive drug tests than CFV crewmembers. CFV vs. SPV Post-Accident positive drug & alcohol tests (per SMI): Does chemical testing reduce marine casualties related to drug and alcohol use? Post-Accident positive drug tests were compared to the yearly 2003-2011 serious marine incident (SMI) in which drug tests are report- ed. Comparisons were presented ?per-incident? instead of ?per-person? and include only SMIs in which drug tests are reported. Figure 4 shows SPV Post-Accident positive drug tests per SMI are much lower than CFV BY THE NUMBERSDrug & Alcohol Testing of Commercial Marine Personnel 8 MNOctober 2013MN October2013 Layout 1-17.indd 8MN October2013 Layout 1-17.indd 810/1/2013 9:53:22 AM10/1/2013 9:53:22 AM