
Page 10: of Marine News Magazine (October 2013)
Manning: Recruitment & Retention
Read this page in Pdf, Flash or Html5 edition of October 2013 Marine News Magazine
 9
9
 11
11
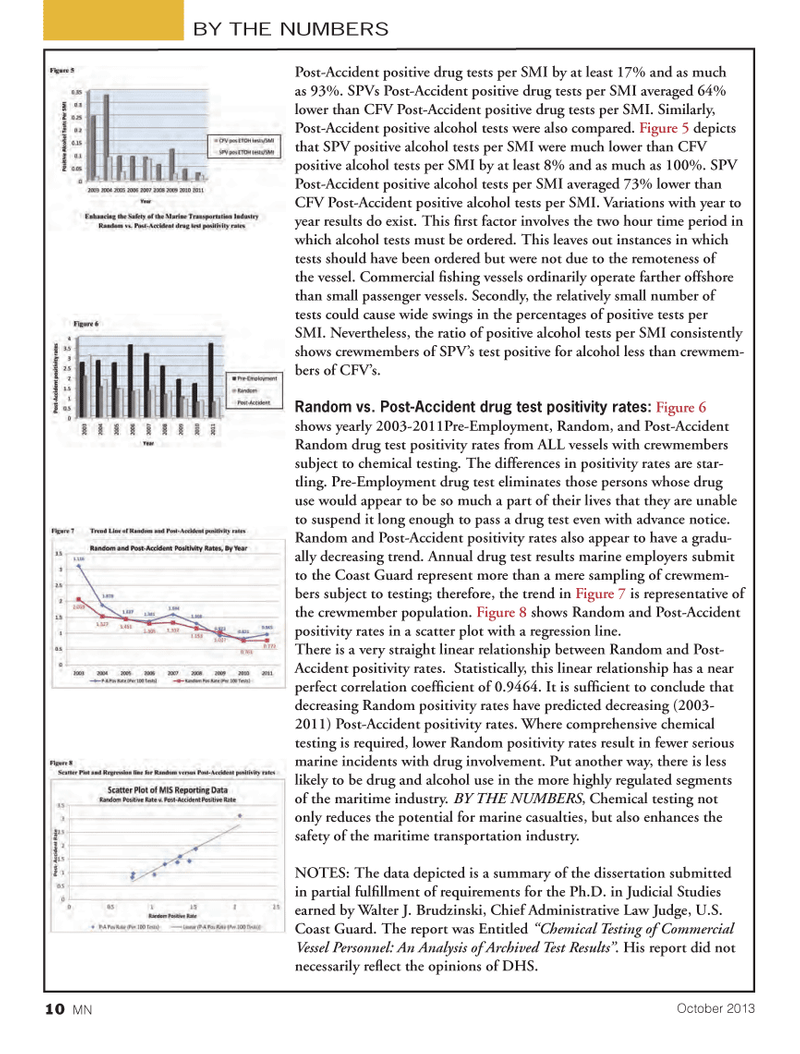
Post-Accident positive drug tests per SMI by at least 17% and as much as 93%. SPVs Post-Accident positive drug tests per SMI averaged 64% lower than CFV Post-Accident positive drug tests per SMI. Similarly, Post-Accident positive alcohol tests were also compared. Figure 5 depicts that SPV positive alcohol tests per SMI were much lower than CFV positive alcohol tests per SMI by at least 8% and as much as 100%. SPV Post-Accident positive alcohol tests per SMI averaged 73% lower than CFV Post-Accident positive alcohol tests per SMI. Variations with year to year results do exist. This Þ rst factor involves the two hour time period in which alcohol tests must be ordered. This leaves out instances in which tests should have been ordered but were not due to the remoteness of the vessel. Commercial Þ shing vessels ordinarily operate farther offshore than small passenger vessels. Secondly, the relatively small number of tests could cause wide swings in the percentages of positive tests per SMI. Nevertheless, the ratio of positive alcohol tests per SMI consistently shows crewmembers of SPVÕs test positive for alcohol less than crewmem- bers of CFVÕs. Random vs. Post-Accident drug test positivity rates: Figure 6 shows yearly 2003-2011Pre-Employment, Random, and Post-Accident Random drug test positivity rates from ALL vessels with crewmembers subject to chemical testing. The differences in positivity rates are star- tling. Pre-Employment drug test eliminates those persons whose drug use would appear to be so much a part of their lives that they are unable to suspend it long enough to pass a drug test even with advance notice. Random and Post-Accident positivity rates also appear to have a gradu- ally decreasing trend. Annual drug test results marine employers submit to the Coast Guard represent more than a mere sampling of crewmem- bers subject to testing; therefore, the trend in Figure 7 is representative of the crewmember population. Figure 8 shows Random and Post-Accident positivity rates in a scatter plot with a regression line. There is a very straight linear relationship between Random and Post- Accident positivity rates. Statistically, this linear relationship has a near perfect correlation coefÞ cient of 0.9464. It is sufÞ cient to conclude that decreasing Random positivity rates have predicted decreasing (2003- 2011) Post-Accident positivity rates. Where comprehensive chemical testing is required, lower Random positivity rates result in fewer serious marine incidents with drug involvement. Put another way, there is less likely to be drug and alcohol use in the more highly regulated segments of the maritime industry. BY THE NUMBERS , Chemical testing not only reduces the potential for marine casualties, but also enhances the safety of the maritime transportation industry. NOTES: The data depicted is a summary of the dissertation submitted in partial fulÞ llment of requirements for the Ph.D. in Judicial Studies earned by Walter J. Brudzinski, Chief Administrative Law Judge, U.S. Coast Guard. The report was Entitled ?Chemical Testing of Commercial Vessel Personnel: An Analysis of Archived Test Results? . His report did not necessarily reß ect the opinions of DHS. BY THE NUMBERSOctober 201310 MNMN October2013 Layout 1-17.indd 10MN October2013 Layout 1-17.indd 109/30/2013 3:11:19 PM9/30/2013 3:11:19 PM