Page 35: of Marine News Magazine (June 2014)
Dredging & Marine Construction
Read this page in Pdf, Flash or Html5 edition of June 2014 Marine News Magazine
 34
34
 36
36
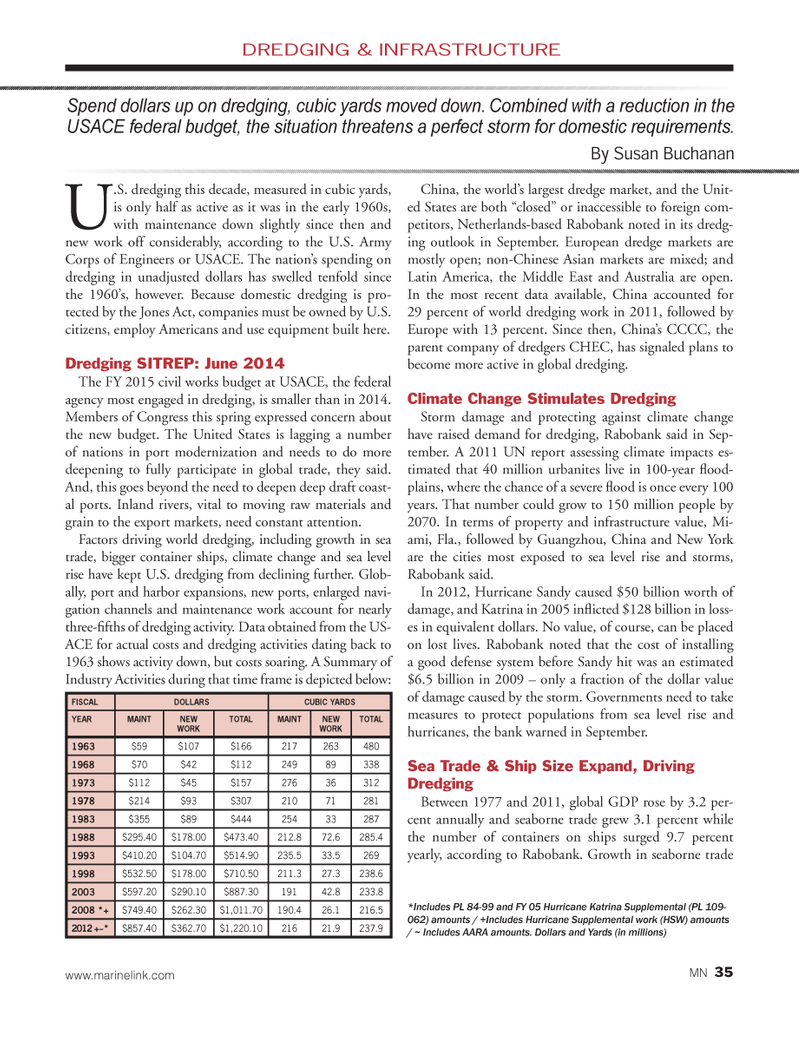
U.S. dredging this decade, measured in cubic yards, is only half as active as it was in the early 1960s, with maintenance down slightly since then and new work off considerably, according to the U.S. Army Corps of Engineers or USACE. The nation?s spending on dredging in unadjusted dollars has swelled tenfold since the 1960?s, however. Because domestic dredging is pro- tected by the Jones Act, companies must be owned by U.S. citizens, employ Americans and use equipment built here. Dredging SITREP: June 2014 The FY 2015 civil works budget at USACE, the federal agency most engaged in dredging, is smaller than in 2014. Members of Congress this spring expressed concern about the new budget. The United States is lagging a number of nations in port modernization and needs to do more deepening to fully participate in global trade, they said. And, this goes beyond the need to deepen deep draft coast- al ports. Inland rivers, vital to moving raw materials and grain to the export markets, need constant attention. Factors driving world dredging, including growth in sea trade, bigger container ships, climate change and sea level rise have kept U.S. dredging from declining further. Glob- ally, port and harbor expansions, new ports, enlarged navi- gation channels and maintenance work account for nearly three- fths of dredging activity. Data obtained from the US- ACE for actual costs and dredging activities dating back to 1963 shows activity down, but costs soaring. A Summary of Industry Activities during that time frame is depicted below: China, the world?s largest dredge market, and the Unit- ed States are both ?closed? or inaccessible to foreign com- petitors, Netherlands-based Rabobank noted in its dredg- ing outlook in September. European dredge markets are mostly open; non-Chinese Asian markets are mixed; and Latin America, the Middle East and Australia are open. In the most recent data available, China accounted for 29 percent of world dredging work in 2011, followed by Europe with 13 percent. Since then, China?s CCCC, the parent company of dredgers CHEC, has signaled plans to become more active in global dredging. Climate Change Stimulates Dredging Storm damage and protecting against climate change have raised demand for dredging, Rabobank said in Sep- tember. A 2011 UN report assessing climate impacts es- timated that 40 million urbanites live in 100-year ood-plains, where the chance of a severe ood is once every 100 years. That number could grow to 150 million people by 2070. In terms of property and infrastructure value, Mi- ami, Fla., followed by Guangzhou, China and New York are the cities most exposed to sea level rise and storms, Rabobank said.In 2012, Hurricane Sandy caused $50 billion worth of damage, and Katrina in 2005 in icted $128 billion in loss- es in equivalent dollars. No value, of course, can be placed on lost lives. Rabobank noted that the cost of installing a good defense system before Sandy hit was an estimated $6.5 billion in 2009 ? only a fraction of the dollar value of damage caused by the storm. Governments need to take measures to protect populations from sea level rise and hurricanes, the bank warned in September. Sea Trade & Ship Size Expand, Driving Dredging Between 1977 and 2011, global GDP rose by 3.2 per- cent annually and seaborne trade grew 3.1 percent while the number of containers on ships surged 9.7 percent yearly, according to Rabobank. Growth in seaborne trade DREDGING & INFRASTRUCTURESpend dollars up on dredging, cubic yards moved down. Combined with a reduction in the USACE federal budget, the situation threatens a perfect storm for domestic requirements. By Susan BuchananFISCALDOLLARSCUBIC YARDS YEARMAINTNEW WORKTOTALMAINTNEW WORKTOTAL 1963$59$107$166217263480 1968$70$42$11224989338 1973$112$45$15727636312 1978$214$93$30721071281 1983$355$89$44425433287 1988$295.40$178.00$473.40212.872.6285.4 1993$410.20$104.70$514.90235.533.5269 1998$532.50$178.00$710.50211.327.3238.6 2003$597.20$290.10$887.3019142.8233.8 2008 *+$749.40$262.30$1,011.70190.426.1216.5 2012 +~*$857.40$362.70$1,220.1021621.9237.9 *Includes PL 84-99 and FY 05 Hurricane Katrina Supplemental (PL 109- 062) amounts / +Includes Hurricane Supplemental work (HSW) amounts / ~ Includes AARA amounts. Dollars and Yards (in millions) MN 35www.marinelink.com MN June14 Layout 32-49.indd 35MN June14 Layout 32-49.indd 355/20/2014 10:22:00 AM5/20/2014 10:22:00 AM