
Page 10: of Marine News Magazine (April 2015)
Shipyard Report: Construction & Repair
Read this page in Pdf, Flash or Html5 edition of April 2015 Marine News Magazine
 9
9
 11
11
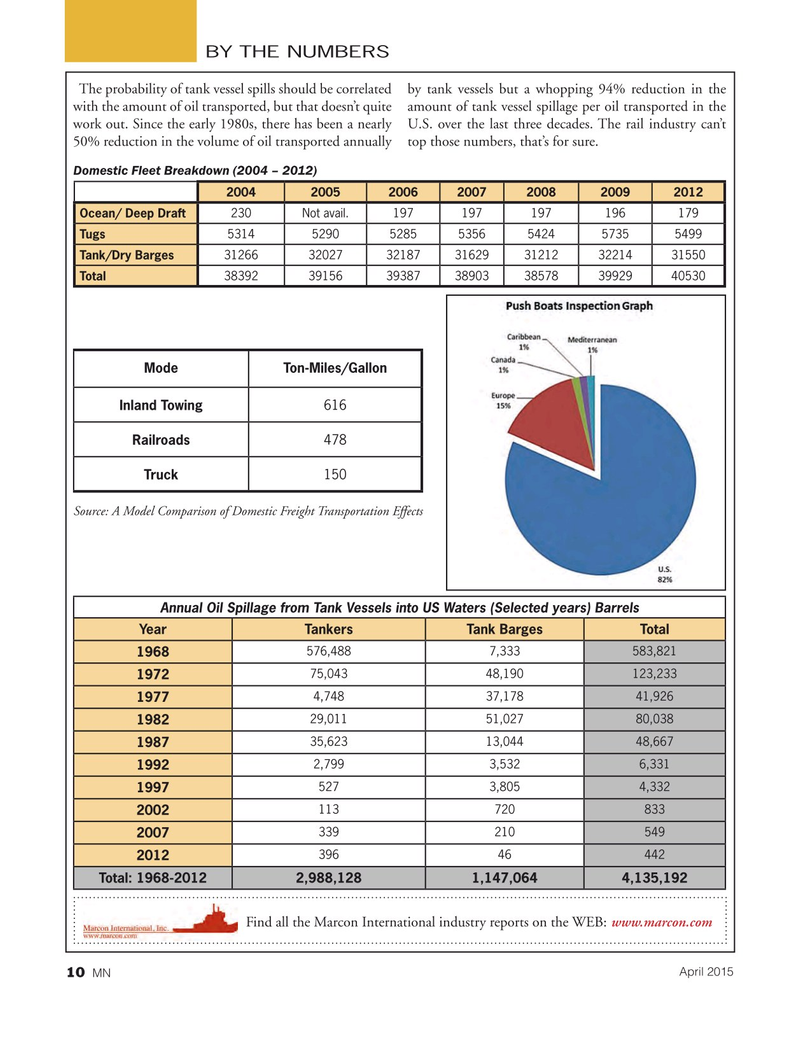
BY THE NUMBERS
The probability of tank vessel spills should be correlated by tank vessels but a whopping 94% reduction in the with the amount of oil transported, but that doesn’t quite amount of tank vessel spillage per oil transported in the work out. Since the early 1980s, there has been a nearly U.S. over the last three decades. The rail industry can’t 50% reduction in the volume of oil transported annually top those numbers, that’s for sure.
Domestic Fleet Breakdown (2004 – 2012) 2004200520062007200820092012
Ocean/ Deep Draft 230Not avail.197197197196179
Tugs 5314529052855356542457355499
Tank/Dry Barges 31266320273218731629312123221431550
Total 38392391563938738903385783992940530
Mode Ton-Miles/Gallon
Inland Towing 616
Railroads 478
Truck 150
Source: A Model Comparison of Domestic Freight Transportation Effects
Annual Oil Spillage from Tank Vessels into US Waters (Selected years) Barrels
Year Tankers Tank Barges Total 576,488 7,333 583,821 1968 75,043 48,190 123,233 1972 4,748 37,178 41,926 1977 29,011 51,027 80,038 1982 35,623 13,044 48,667 1987 2,799 3,532 6,331 1992 527 3,805 4,332 1997 113 720 833 2002 339 210 549 2007 396 46 442 2012
Total: 1968-2012 2,988,128 1,147,064 4,135,192
Find all the Marcon International industry reports on the WEB: www.marcon.com
April 2015
MN 10