
Page 10: of Marine News Magazine (July 2016)
Propulsion Technology
Read this page in Pdf, Flash or Html5 edition of July 2016 Marine News Magazine
 9
9
 11
11
BY THE NUMBERS
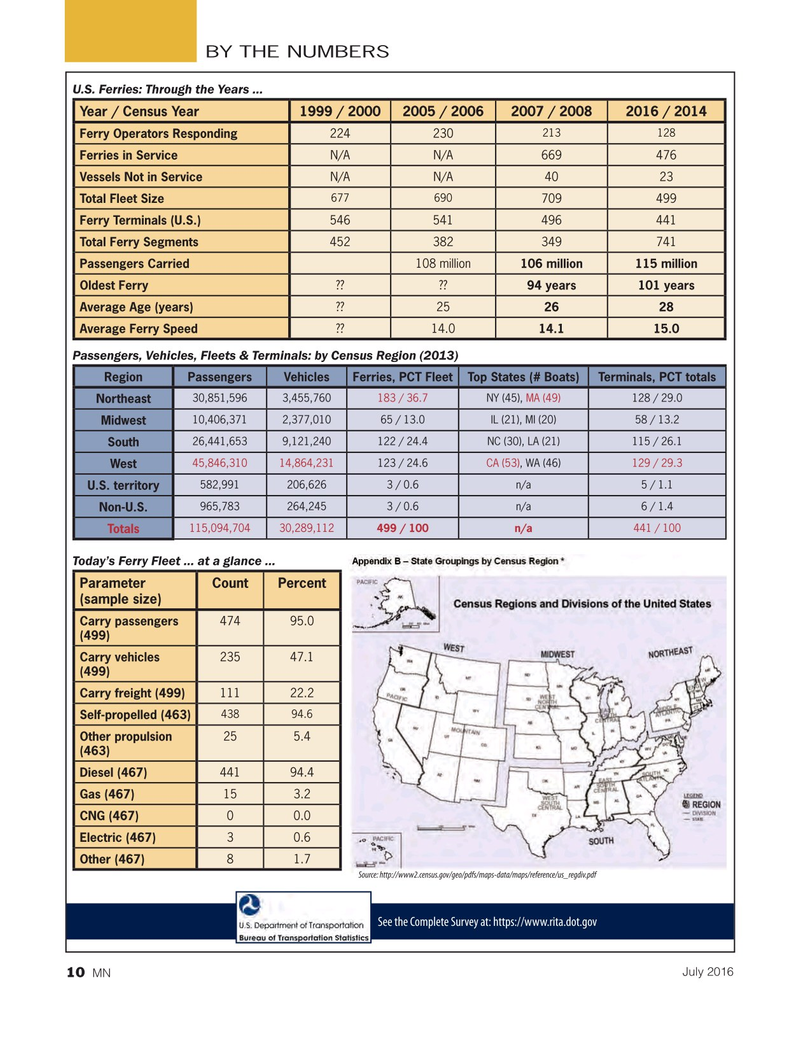
U.S. Ferries: Through the Years …
Year / Census Year 1999 / 20002005 / 20062007 / 20082016 / 2014 213 128
Ferry Operators Responding 224 230
Ferries in Service N/A N/A 669 476
Vessels Not in Service N/A N/A 40 23 677 690
Total Fleet Size 709 499
Ferry Terminals (U.S.) 546 541 496 441
Total Ferry Segments 452 382 349 741
Passengers Carried 108 million 106 million115 million
Oldest Ferry ?? ?? 94 years 101 years
Average Age (years) ?? 25 26 28
Average Ferry Speed ?? 14.0 14.1 15.0
Passengers, Vehicles, Fleets & Terminals: by Census Region (2013)
RegionPassengersVehiclesFerries, PCT FleetTop States (# Boats)Terminals, PCT totals 30,851,5963,455,760 183 / 36.7 NY (45), MA (49) 128 / 29.0
Northeast 10,406,3712,377,01065 / 13.0 IL (21), MI (20) 58 / 13.2
Midwest 26,441,6539,121,240122 / 24.4 NC (30), LA (21) 115 / 26.1
South 45,846,31014,864,231 123 / 24.6 CA (53), WA (46) 129 / 29.3
West 582,991206,626 3 / 0.6 n/a 5 / 1.1
U.S. territory 965,783264,245 3 / 0.6 n/a 6 / 1.4
Non-U.S.
115,094,70430,289,112 499 / 100 n/a 441 / 100
Totals
Today’s Ferry Fleet … at a glance …
Parameter CountPercent (sample size)
Carry passengers 47495.0 (499)
Carry vehicles 23547.1 (499)
Carry freight (499) 11122.2 43894.6
Self-propelled (463)
Other propulsion 255.4 (463)
Diesel (467) 44194.4
Gas (467) 153.2
CNG (467) 0 0.0
Electric (467) 3 0.6
Other (467) 8 1.7
Source: http://www2.census.gov/geo/pdfs/maps-data/maps/reference/us_regdiv.pdf
See the Complete Survey at: https://www.rita.dot.gov
July 2016 10
MN
MN July16 Layout 1-17.indd 10 6/20/2016 3:19:30 PM