
Page 10: of Marine News Magazine (January 2017)
Passenger Vessels & Ferries
Read this page in Pdf, Flash or Html5 edition of January 2017 Marine News Magazine
 9
9
 11
11
BY THE NUMBERS nals in time for their efforts to be effective. the 232 entries. And, while in many entries, one or more
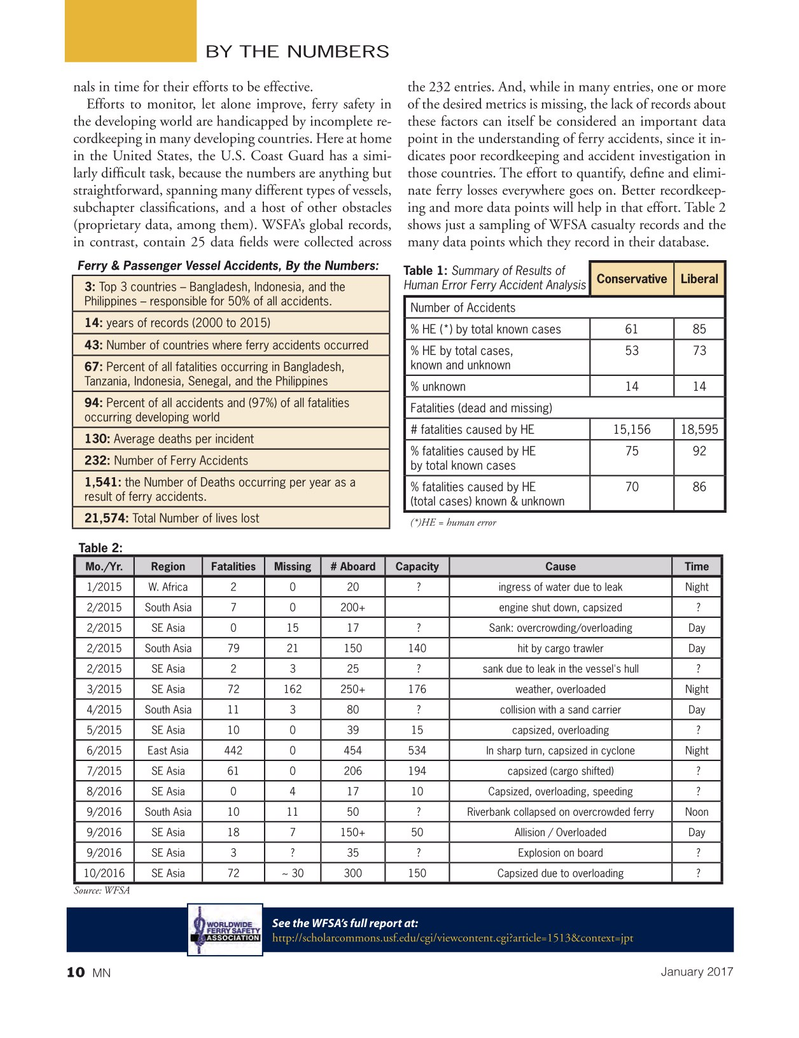
Efforts to monitor, let alone improve, ferry safety in of the desired metrics is missing, the lack of records about the developing world are handicapped by incomplete re- these factors can itself be considered an important data cordkeeping in many developing countries. Here at home point in the understanding of ferry accidents, since it in- in the United States, the U.S. Coast Guard has a simi- dicates poor recordkeeping and accident investigation in larly dif? cult task, because the numbers are anything but those countries. The effort to quantify, de? ne and elimi- straightforward, spanning many different types of vessels, nate ferry losses everywhere goes on. Better recordkeep- subchapter classi? cations, and a host of other obstacles ing and more data points will help in that effort. Table 2 (proprietary data, among them). WSFA’s global records, shows just a sampling of WFSA casualty records and the in contrast, contain 25 data ? elds were collected across many data points which they record in their database.
Ferry & Passenger Vessel Accidents, By the Numbers:
Table 1: Summary of Results of
ConservativeLiberal
Human Error Ferry Accident Analysis 3: Top 3 countries – Bangladesh, Indonesia, and the
Philippines – responsible for 50% of all accidents.
Number of Accidents 14: years of records (2000 to 2015) % HE (*) by total known cases6185 43: Number of countries where ferry accidents occurred % HE by total cases, 5373 known and unknown 67: Percent of all fatalities occurring in Bangladesh,
Tanzania, Indonesia, Senegal, and the Philippines % unknown1414 94: Percent of all accidents and (97%) of all fatalities
Fatalities (dead and missing) occurring developing world # fatalities caused by HE15,15618,595 130: Average deaths per incident % fatalities caused by HE 7592 232: Number of Ferry Accidents by total known cases 1,541: the Number of Deaths occurring per year as a % fatalities caused by HE 7086 result of ferry accidents.
(total cases) known & unknown 21,574: Total Number of lives lost (*)HE = human error
Table 2:
Mo./Yr.RegionFatalitiesMissing# AboardCapacity Cause Time 1/2015W. Africa2 020 ? ingress of water due to leak Night 2/2015South Asia7 0200+ engine shut down, capsized ?
2/2015SE Asia01517 ? Sank: overcrowding/overloading Day 2/2015South Asia7921150140 hit by cargo trawler Day 2/2015SE Asia2 325 ? sank due to leak in the vessel's hull ?
3/2015SE Asia72162250+176 weather, overloaded Night 4/2015South Asia11380 ? collision with a sand carrier Day 5/2015SE Asia1003915 capsized, overloading ?
6/2015East Asia4420454534 In sharp turn, capsized in cycloneNight 7/2015SE Asia610206194 capsized (cargo shifted) ?
8/2016SE Asia0 41710 Capsized, overloading, speeding ?
9/2016South Asia101150 ?Riverbank collapsed on overcrowded ferryNoon 9/2016SE Asia187150+50 Allision / Overloaded Day 9/2016SE Asia3 ? 35 ? Explosion on board ?
10/2016SE Asia72~ 30300150 Capsized due to overloading ?
Source: WFSA
See the WFSA’s full report at: http://scholarcommons.usf.edu/cgi/viewcontent.cgi?article=1513&context=jpt
January 2017
MN 10
MN Jan17 Layout 1-17.indd 10 MN Jan17 Layout 1-17.indd 10 1/5/2017 4:20:24 PM1/5/2017 4:20:24 PM