Page 10: of Marine News Magazine (April 2017)
Boatbuilding: Construction & Repair
Read this page in Pdf, Flash or Html5 edition of April 2017 Marine News Magazine
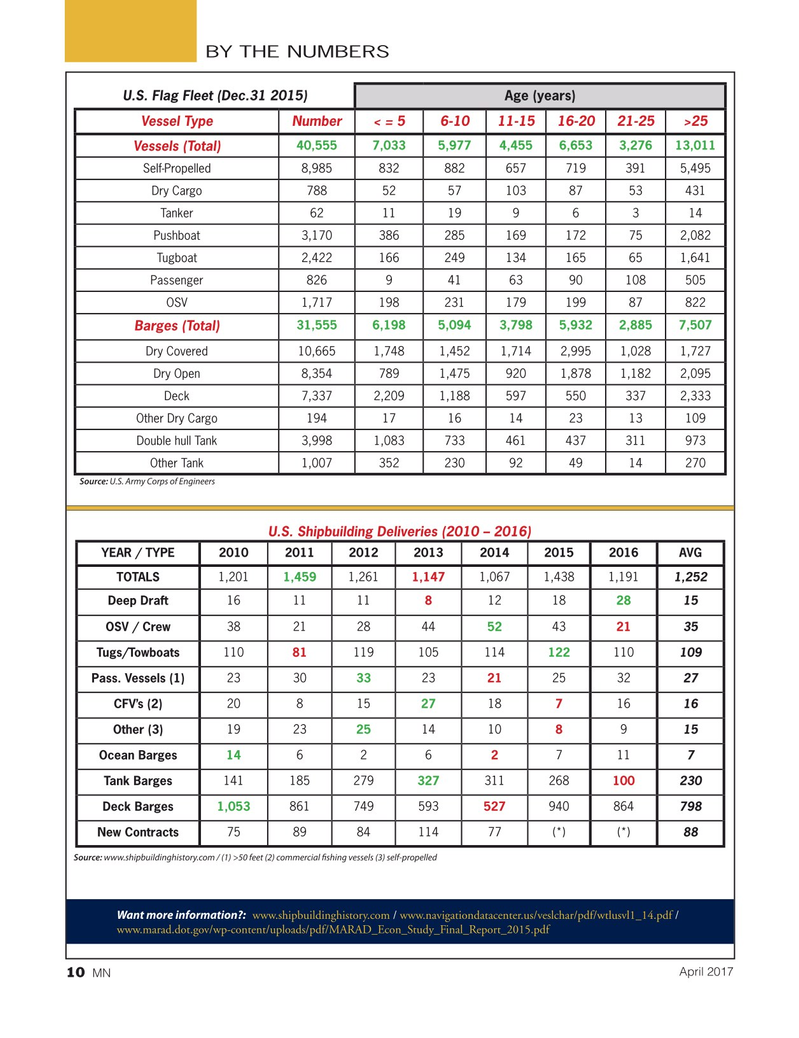
BY THE NUMBERS
U.S. Flag Fleet (Dec.31 2015) Age (years)
Vessel Type Number< = 56-1011-1516-2021-25>25 40,5557,0335,9774,4556,6533,27613,011
Vessels (Total)
Self-Propelled 8,9858328826577193915,495
Dry Cargo 78852571038753431
Tanker 62111996314
Pushboat 3,170386285169172752,082
Tugboat 2,422166249134165651,641
Passenger 8269416390108505
OSV 1,71719823117919987822 31,5556,1985,0943,7985,9322,8857,507
Barges (Total)
Dry Covered 10,6651,7481,4521,7142,9951,0281,727
Dry Open 8,3547891,4759201,8781,1822,095
Deck 7,3372,2091,1885975503372,333
Other Dry Cargo 1941716142313109
Double hull Tank 3,9981,083733461437311973
Other Tank 1,007352230924914270
Source: U.S. Army Corps of Engineers
U.S. Shipbuilding Deliveries (2010 – 2016)
YEAR / TYPE2010201120122013201420152016AVG
TOTALS 1,201 1,459 1,261 1,147 1,0671,4381,191 1,252
Deep Draft 16 1111 8 1218 28 15
OSV / Crew 38212844 52 43 21 35
Tugs/Towboats 110 81 119105114 122 110 109
Pass. Vessels (1) 2330 33 23 21 2532 27
CFV’s (2) 20815 27 18 7 16 16
Other (3) 19 23 25 1410 8 9 15
Ocean Barges 14 6262 7117
Tank Barges 141185279 327 311268 100 230
Deck Barges 1,053 861749593 527 940864 798
New Contracts 75 898411477(*)(*) 88
Source: www.shipbuildinghistory.com / (1) >50 feet (2) commercial f shing vessels (3) self-propelled
Want more information?: www.shipbuildinghistory.com / www.navigationdatacenter.us/veslchar/pdf/wtlusvl1_14.pdf / www.marad.dot.gov/wp-content/uploads/pdf/MARAD_Econ_Study_Final_Report_2015.pdf
April 2017
MN 10

 9
9

 11
11
