Page 10: of Marine News Magazine (June 2017)
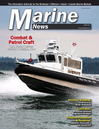
Combat & Patrol Craft Annual
Read this page in Pdf, Flash or Html5 edition of June 2017 Marine News Magazine
 9
9
 11
11
BY THE NUMBERS re? neries in Washington and Louisiana. To the credit of rail operators, and over the last 35 years, the amount of oil being transported that then spilled was decreasing rapidly – in the early 1980s, about one barrel of oil spilled for every 1,000 barrels transported. Over the last decade, there has been a 91% decrease in the spillage rate since the 1980s – so that one barrel spilled for every 12,000 barrels transported. In the last two years, the rate of spillage per oil transported has decreased to one barrel spilled for every 23,000 barrels transported. Impressive. But, with the dramatic increase in the overall amount of oil transported by rail, the absolute amount of oil spilled each year has increased by 276%.
One way to compare overall modal environmental performance is to look at the number of barrels spilled in a given era or year and then look at improvements over time, as shown below:
Time Period Pipelines Tankers (*) YEARPipelines (totals)Tankers (*) (AVG) / bbls (AVG) / bbls (totals) 1968 - 1972 306,612297,000 1985 (#) 143 / 110,468549 / 105,142 2003 - 2012 60,3744,000 2009 (#) 88 / 33,100126 / 448
PCT Change 80 %98% PCT Change 30%95% (*) includes tank barges and tank vessels (#) Depicts number of incidents / barrels.
The improvement in environmental performance for both pipelines and tank vessels is remarkable, but the pipe- line improvements pale in comparison to that achieved for waterborne cargoes over the same time frames. Another way is much more telling. As depicted below, three modes – rail, water and pipelines – are all compared in terms of spillage rates per 100 barrels transported. Really, it’s the only fair way to do it. And the answers are startlingly clear – ? ve times the oil transported by rail will be spilled as that which might be carried (and spilled) on a tank vessel, and pipelines will spill twice as much as a tank vessel when comparing similar volumes transported. Our take from the
MarineNews shop? It’s time to get that oil back onto – and not into – the water:
Mode Tank Vessels (&) Pipelines Rail
Rate of Spillage (*) 0.001 barrels0.002 barrels0.005 barrels
Data Reference Dates 2003 – 20122010 – 20152010 – 2015 (*) Rate of spillage for every 100 barrels transported. (&) includes tankers, barges and ATB’s.
Dagmar Schmidt Etkin has 30 years of experience in environmental analysis — 14 years investigating issues in population biology and ecological systems, and 16 years specializing in the analysis of oil spills. She has earned a Ph.D. from Harvard University, Organismic & Evolutionary Biology (ecology, statistics, population modeling), 1982, a Masters degree from Harvard University (Biology), and a B.A. from the University of Rochester in 1977.
She is a welcome addition to our pages. Reach her at: [email protected]
June 2017
MN 10