Page 10: of Marine News Magazine (February 2019)
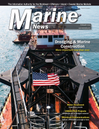
Dredging & Marine Construction
Read this page in Pdf, Flash or Html5 edition of February 2019 Marine News Magazine
 9
9
 11
11
BY THE NUMBERS
Maritime Training Benchmarked
In 2017, Marine Learning Systems, New Wave Media 2016 to 2017 than decreased it. For those increasing their and the World Maritime University, signed a Memoran- budget, the typical increase fell in the 5% to 25% range. dum of Understanding as partners for a new initiative Increases in 2018 are anticipated to be larger and more designed to collaboratively help ensure safe, effcient and common than from 2016 to 2017. Increased regulatory sustainable maritime operations on clean oceans. It will requirements, a greater focus on safety and capital expen- do so by providing the maritime industry with objective ditures were the most common reasons cited for changes to and comprehensive data on how it manages and conducts the training budget. But, there is, apparently, no training training for shipboard competencies and the effects of “Silver Bullet.” A broad range of training methods were drivers, such as technology, on this training. employed. That said; of all methods identifed, e-learning
This data, updated annually by means of a global survey, and simulation were identifed as the two which operators provides insights that can lead to enhanced policy-setting, planned to increase the use of most in the future.
decision-making, benchmarking and operational optimiza- Of particular note, the top view shared by over a tenth tion by industry and regulatory authorities at all levels. Mar- of the respondents is that the STCW is not aligned with
TID’s core principles include ethical integrity, objectivity industry needs and that it needs to be updated to become and confdentiality. The secure and anonymized MarTID more relevant. Conversely, a similar proportion of respon- data provides insights into training practices, budgets, prior- dents believe that the current STCW Convention and ities, challenges and perspectives as well as a global picture of Code are adequate for international training as is, with maritime training that is not currently available anywhere. the caveat that it is implemented effectively. No doubt,
To that end, the frst inaugural 2018 MarTID report is inland and Jones Act coastwise would have much to say now available. Importantly, this data represents a Global about that matter. The 2019 MarTID survey, now under-
Response. Respondents hailed from all over the world, way, might just be the perfect vehicle for domestic stakeholders with most operating in North America, Europe and Asia- to let their positions be known. Your participation, approx-
Pacifc, and operated a wide range of vessel types. Hence, imately 20 minutes of your time, helps to broaden the the reported data represents a broad cross-section of op- depth of information available to all stakeholders. erations regions and types of operator.
ho esponded In you dId
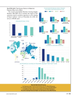
So, what did we fnd out? You might be surprised. Spe- w r 2018? … cifcally, the report provides information on: The average age of the respondent was 48 years, with the majority being current or former seafarers. A large • industry spend on training, resources used, and future trends; majority had acquired a post-secondary degree; while • methods, tools and techniques for training; other education backgrounds included achieving Master • the purposes and goals that training serves within organizations;
Mariner and Pilot qualifcations. Nearly a quarter of the • how training is tracked and measured within a company; respondents currently work as instructors or senior train- • new initiatives undertaken by operators; ers, while the remainder of respondents were spread out • common challenges & anticipated training trends.
across various management roles. We also had consul- mportant ake ways
I ‘t a ’ tants, advisors and retired seafarers participate. The fol-
More operators increased their training budget from lowing table illustrates the breakdown in roles:
The frst MarTID Report: at a glance & By the Numbers … 1: smallest percentage of total operating budget spent on training by any one company.
8.4: AVG (years) of experience that respondents had worked in training in their organization.
13: Percent of respondents that felt that their training did not cover their operational risks.
15: Percent of respondents who believe that STCW is not aligned to industry needs.
20: Largest reported percent of total operating budget spent on training.
32: Percent of responders who said that safety is the chief driver of their training efforts.
57: Percent of companies employing a learning management system (LMS) to deliver & track online training.
60: Percent of companies using Simulators to train engineering offcers.
70: Percent of respondents felt that their training practices were better than average.
77: Percent of respondents that felt their training covered operational risks.
86: Percent of companies using Simulators to train bridge offcers.
819: USD per Seafarer that the average organization spent for training in 2017.
February 2019 10 MN