Page 11: of Marine News Magazine (January 2020)
Passenger Vessels & Ferries
Read this page in Pdf, Flash or Html5 edition of January 2020 Marine News Magazine
 10
10
 12
12
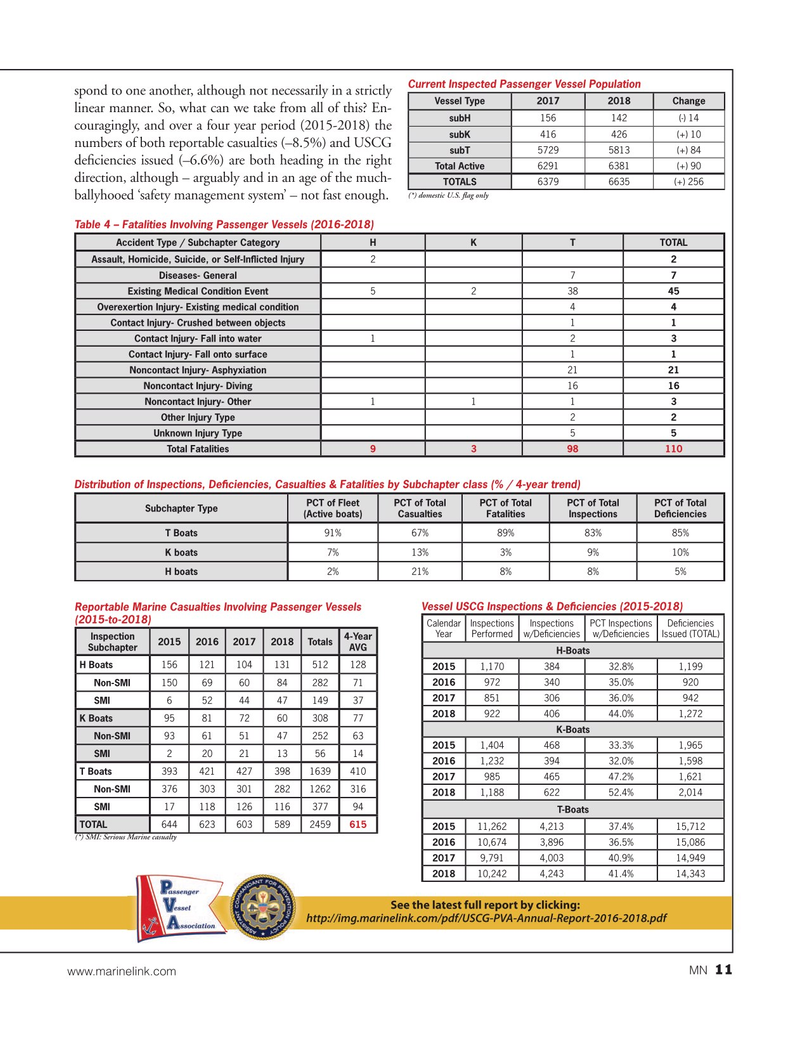
Current Inspected Passenger Vessel Population spond to one another, although not necessarily in a strictly
Vessel Type 2017 2018Change linear manner. So, what can we take from all of this? En- subH 156 142 (-) 14 couragingly, and over a four year period (2015-2018) the subK 416 426 (+) 10 numbers of both reportable casualties (–8.5%) and USCG subT 5729 5813 (+) 84 de? ciencies issued (–6.6%) are both heading in the right
Total Active 6291 6381 (+) 90 direction, although – arguably and in an age of the much-
TOTALS 6379 6635(+) 256 (*) domestic U.S. ? ag only ballyhooed ‘safety management system’ – not fast enough.
Table 4 – Fatalities Involving Passenger Vessels (2016-2018)
Accident Type / Subchapter Category H K T TOTAL
Assault, Homicide, Suicide, or Self-In? icted Injury 2 2
Diseases- General 7 7
Existing Medical Condition Event 5 2 38 45
Overexertion Injury- Existing medical condition 4 4
Contact Injury- Crushed between objects 1 1 3 Contact Injury- Fall into water 12
Contact Injury- Fall onto surface 1 1
Noncontact Injury- Asphyxiation 21 21
Noncontact Injury- Diving 16 16
Noncontact Injury- Other 1113
Other Injury Type 2 2
Unknown Injury Type 5 5
Total Fatalities 9 3 98 110
Distribution of Inspections, De? ciencies, Casualties & Fatalities by Subchapter class (% / 4-year trend)
PCT of Fleet PCT of Total PCT of Total PCT of Total PCT of Total
Subchapter Type (Active boats) Casualties Fatalities Inspections De? ciencies
T Boats 91% 67% 89% 83% 85%
K boats 7% 13% 3% 9% 10%
H boats 2% 21% 8% 8% 5%
Reportable Marine Casualties Involving Passenger Vessels Vessel USCG Inspections & De? ciencies (2015-2018) (2015-to-2018)
Calendar Inspections Inspections PCT Inspections De? ciencies
Year Performed w/De? ciencies w/De? ciencies Issued (TOTAL)
Inspection 4-Year 2015201620172018Totals
Subchapter AVG
H-Boats
H Boats 156121104131512128 2015 1,170384 32.8%1,199 Non-SMI 15069608428271 2016 972340 35.0% 920 2017 851306 36.0% 942 SMI 652444714937 2018 922406 44.0%1,272
K Boats 9581726030877
K-Boats Non-SMI 9361514725263 2015 1,404468 33.3%1,965 SMI 22021135614 2016 1,232394 32.0%1,598
T Boats 3934214273981639410 2017 985465 47.2%1,621 Non-SMI 3763033012821262316 2018 1,188622 52.4%2,014 SMI 1711812611637794
T-Boats
TOTAL 6446236035892459 615 2015 11,2624,21337.4%15,712 (*) SMI: Serious Marine casualty 2016 10,6743,89636.5%15,086 2017 9,7914,00340.9%14,949 2018 10,2424,24341.4%14,343
See the latest full report by clicking: http://img.marinelink.com/pdf/USCG-PVA-Annual-Report-2016-2018.pdf 11 www.marinelink.com MN