Page 11: of Marine News Magazine (February 2020)
Pushboats,Tugs & Assist Vessels
Read this page in Pdf, Flash or Html5 edition of February 2020 Marine News Magazine
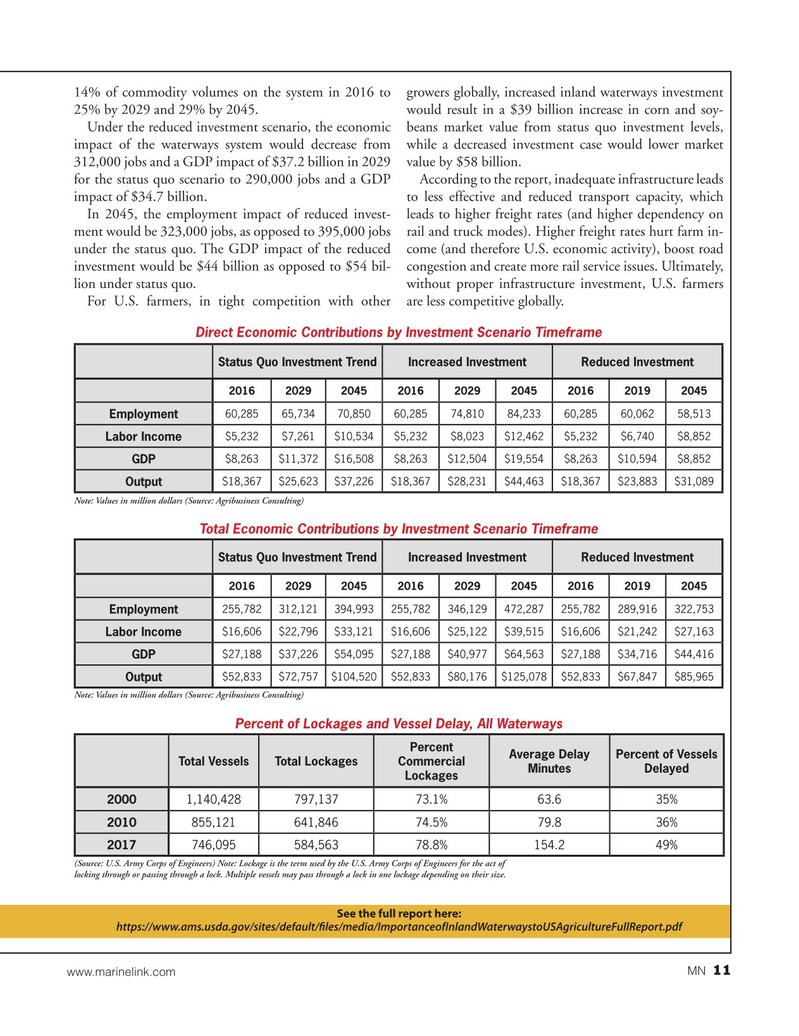
14% of commodity volumes on the system in 2016 to growers globally, increased inland waterways investment 25% by 2029 and 29% by 2045. would result in a $39 billion increase in corn and soy-
Under the reduced investment scenario, the economic beans market value from status quo investment levels, impact of the waterways system would decrease from while a decreased investment case would lower market 312,000 jobs and a GDP impact of $37.2 billion in 2029 value by $58 billion.
for the status quo scenario to 290,000 jobs and a GDP According to the report, inadequate infrastructure leads impact of $34.7 billion. to less effective and reduced transport capacity, which
In 2045, the employment impact of reduced invest- leads to higher freight rates (and higher dependency on ment would be 323,000 jobs, as opposed to 395,000 jobs rail and truck modes). Higher freight rates hurt farm in- under the status quo. The GDP impact of the reduced come (and therefore U.S. economic activity), boost road investment would be $44 billion as opposed to $54 bil- congestion and create more rail service issues. Ultimately, lion under status quo. without proper infrastructure investment, U.S. farmers
For U.S. farmers, in tight competition with other are less competitive globally.
Direct Economic Contributions by Investment Scenario Timeframe
Status Quo Investment TrendIncreased InvestmentReduced Investment 201620292045201620292045201620192045 60,285 65,73470,85060,28574,81084,23360,28560,062 58,513
Employment $5,232 $7,261$10,534$5,232$8,023$12,462$5,232$6,740$8,852
Labor Income $8,263 $11,372$16,508$8,263$12,504$19,554$8,263$10,594 $8,852
GDP $18,367 $25,623$37,226$18,367$28,231$44,463$18,367$23,883 $31,089
Output
Note: Values in million dollars (Source: Agribusiness Consulting)
Total Economic Contributions by Investment Scenario Timeframe
Status Quo Investment TrendIncreased InvestmentReduced Investment 201620292045201620292045201620192045 255,782312,121394,993255,782346,129472,287255,782289,916 322,753
Employment $16,606$22,796 $33,121$16,606$25,122$39,515$16,606$21,242$27,163
Labor Income $27,188$37,226$54,095$27,188$40,977$64,563$27,188$34,716$44,416
GDP $52,833$72,757$104,520$52,833$80,176$125,078$52,833$67,847 $85,965
Output
Note: Values in million dollars (Source: Agribusiness Consulting)
Percent of Lockages and Vessel Delay, All Waterways
Percent
Average Delay Percent of Vessels
Total VesselsTotal Lockages Commercial
Minutes Delayed
Lockages 2000 1,140,428797,13773.1%63.635% 2010 855,121641,84674.5%79.836% 2017 746,095584,56378.8%154.249% (Source: U.S. Army Corps of Engineers) Note: Lockage is the term used by the U.S. Army Corps of Engineers for the act of locking through or passing through a lock. Multiple vessels may pass through a lock in one lockage depending on their size.
See the full report here: https://www.ams.usda.gov/sites/default/f les/media/ImportanceofInlandWaterwaystoUSAgricultureFullReport.pdf 11 www.marinelink.com MN

 10
10

 12
12
