Page 10: of Marine News Magazine (July 2021)
Propulsion Technology
Read this page in Pdf, Flash or Html5 edition of July 2021 Marine News Magazine
By the
Numbers
Marine Casualties
Each year the U.S. Coast guard publishes a report summarizing statistics and information regarding inspections and enforcement of regulations on U.S. ? agged vessels. The handy account looks at de? ciency and detention rates for each type of inspected domestic vessel, among other things, including casualty events.
A reportable marine casualty includes any marine casualty consisting of a grounding, allision or collision; loss of main propulsion; occurrence materially and adversely affecting the vessel’s seaworthiness; a loss of life; an injury to a person which requires professional medical treatment; damage to property in excess of $75,000; or a discharge or release of a reportable quantity of a hazardous substance into the navigable waters. 46 CFR Subpart 4.05-1.
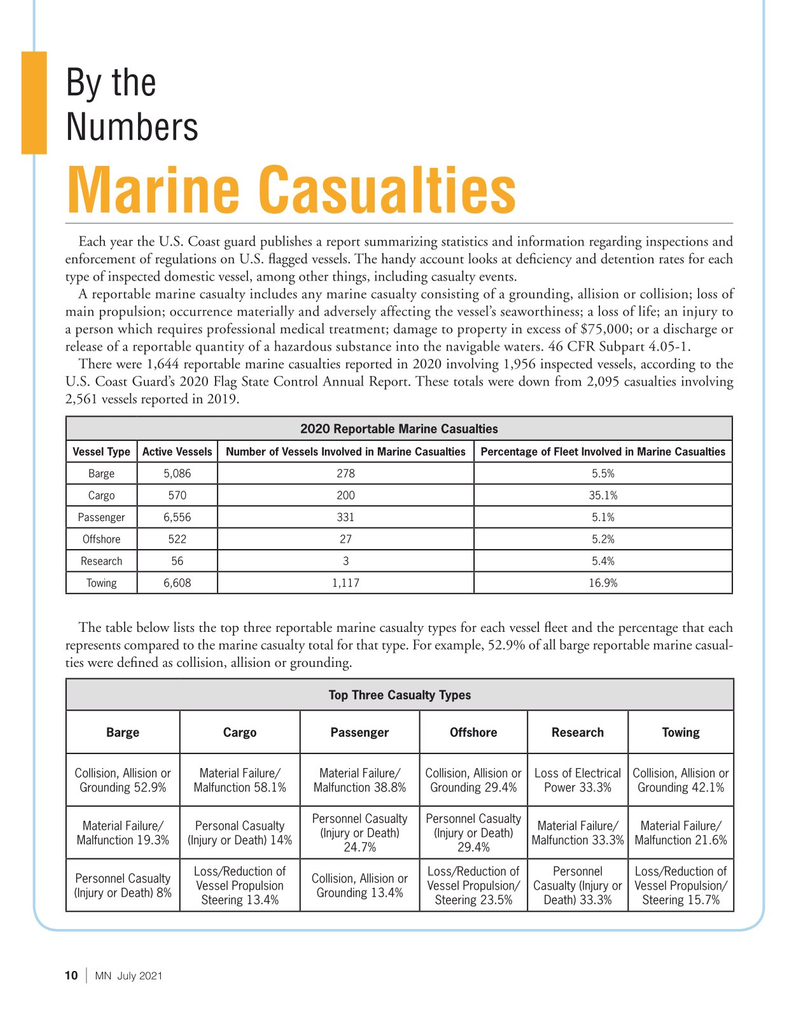
There were 1,644 reportable marine casualties reported in 2020 involving 1,956 inspected vessels, according to the
U.S. Coast Guard’s 2020 Flag State Control Annual Report. These totals were down from 2,095 casualties involving 2,561 vessels reported in 2019.
2020 Reportable Marine Casualties
Vessel TypeActive VesselsNumber of Vessels Involved in Marine CasualtiesPercentage of Fleet Involved in Marine Casualties
Barge5,0862785.5%
Cargo57020035.1%
Passenger6,5563315.1%
Offshore522275.2%
Research5635.4%
Towing6,6081,11716.9%
The table below lists the top three reportable marine casualty types for each vessel ? eet and the percentage that each represents compared to the marine casualty total for that type. For example, 52.9% of all barge reportable marine casual- ties were de? ned as collision, allision or grounding.
Top Three Casualty Types
BargeCargoPassengerOffshoreResearchTowing
Collision, Allision or Material Failure/ Material Failure/ Collision, Allision or Loss of Electrical Collision, Allision or
Grounding 52.9% Malfunction 58.1% Malfunction 38.8% Grounding 29.4% Power 33.3% Grounding 42.1%
Personnel Casualty Personnel Casualty
Material Failure/ Personal Casualty Material Failure/ Material Failure/ (Injury or Death) (Injury or Death)
Malfunction 19.3% (Injury or Death) 14% Malfunction 33.3% Malfunction 21.6% 24.7% 29.4%
Loss/Reduction of Loss/Reduction of Personnel Loss/Reduction of
Personnel Casualty Collision, Allision or
Vessel Propulsion Vessel Propulsion/ Casualty (Injury or Vessel Propulsion/ (Injury or Death) 8% Grounding 13.4%
Steering 13.4% Steering 23.5% Death) 33.3% Steering 15.7% 10
MN July 2021 |

 9
9

 11
11
