Page 10: of Marine News Magazine (January 2025)
Read this page in Pdf, Flash or Html5 edition of January 2025 Marine News Magazine
By the
Numbers
Vessel Characteristics ? rst established in 2005 under the Safe, Accountable, Flex-
Ferry capacity, age, and speed are vessel characteristics ible Ef? cient Transportation Equity Act, which required collected by the NCFO. The average capacity on a pas- that “The Secretary of Transportation, acting through the senger vessel is 346 persons, the median passenger capacity Bureau of Transportation Statistics (BTS), shall establish is 150, and the maximum is 5,200. The average capac- and maintain a national ferry database that shall contain ity of vehicle carrying vessels is 40 vehicles. The median current information regarding routes, vessels, passengers vehicle capacity is 27 and the maximum capacity is 197 and vehicles carried, funding sources and such other infor- vehicles. And, as can be seen in Table 1 above, the average mation the Secretary considers useful.” Subsequent to that operating speed of the reported vessels is 13.3 knots, and The Fixing America’s Surface Transportation (FAST) Act the maximum is 35 knots. The average age of the reported (Dec. 2015) continued the BTS mandate to conduct the vessels is 27 years, a number which, despite myriad ? eet re- NCFO and the requirement that the Federal Highway Ad- placement programs spread out over the past decade, hasn’t ministration use the NCFO data to allocate federal funds changed at all. Actually, I’d bet that it has. That’s just one for ferry boat and terminal construction using a set formu- more statistic that needs closer scrutiny. la. That formula is based on a percentage of the number of passengers and vehicles boarding, and route-miles served.
Passenger and Vehicle Boarding Counts by State And, that funding adds up to a ton of money.
In 2022, ferry operations transported a reported total of The October 2024 edition of MarineNews, for exam- 91.6 million passengers and 22.6 million vehicles within and ple, and in this very space, outlines nearly $300 million in to the United States and its territories. Washington and New funding for 18 projects across 14 states. You have to won-
York states carried the most passengers, 23.6 and 23.2 million der if that funding number might be – say 42% – higher, passengers, respectively. Washington state also transported had every one of the 240 ferry entities responded to the lat- 10.8 million vehicles, over half of the total reported vehicles est plea for data. Better, more robust data could well be the (47.8 percent). Again, these numbers – both the passenger ticket to getting better federal funding for the nation’s all- and vehicle count – are likely to be grossly understated. And, important ferry systems. That’s because policy makers in if so, that’s a good thing. It means that the ferry system(s) are Washington, DC are ? nally waking up to the fact that the thriving and providing real utility to their customers, while intermodal equation includes a modern, easy-to-navigate cleaning up the air we breathe at the same time. connection to the greater waterfront. In the future 2026 survey – which will outline 2024 data – let’s shoot for 100
What’s the bottom Line? percent participation that will show just how much more
The congressional mandate for the NCFO at BTS was critical this ferry sector really is in our everyday lives.
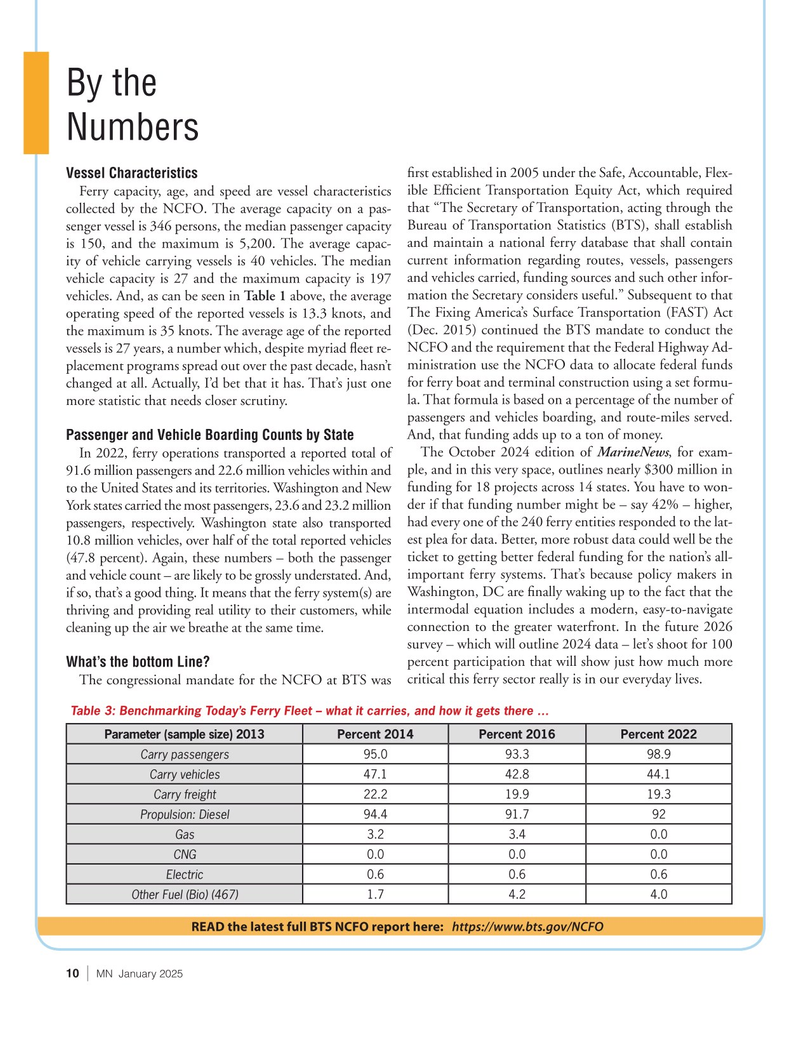
Table 3: Benchmarking Today’s Ferry Fleet – what it carries, and how it gets there …
Parameter (sample size) 2013Percent 2014Percent 2016Percent 2022
Carry passengers 95.093.398.9
Carry vehicles 47.142.844.1
Carry freight 22.219.919.3
Propulsion: Diesel 94.491.792
Gas 3.23.40.0
CNG 0.00.00.0
Electric 0.60.60.6
Other Fuel (Bio) (467) 1.74.24.0
READ the latest full BTS NCFO report here: https://www.bts.gov/NCFO 10 | MN January 2025

 9
9

 11
11
