
Page 43: of Marine Technology Magazine (April 2005)
Read this page in Pdf, Flash or Html5 edition of April 2005 Marine Technology Magazine
 42
42
 44
44
www.seadiscovery.com Marine Technology Reporter 43 into post-processing programs while the vehicle is on the surface or after the project is complete.
Defining Vehicle Missions
The vehicle follows a predefined mission plan created by the user. This mission plan is created in a graphical user environment, allowing a user to draw a mission with the mouse on an image of the mission area. The software also allows for planning of multiple vehicle missions on the same map space. Operators can modify vehicle set points for each leg to a waypoint, speed, depth, special depth such as undulate or spiral dive for data collection.
Additionally, operators can click and drag any waypoints to edit a mission. The program output is an ASCII mis- sion file that is uploaded to the AUV via a wireless inter- face prior to mission start.
Volume Assessment Results
How data is represented in final form is important from several aspects. Graphical representations allow for com- plex data to be displayed in such a way that a simple glance can inform users at one level and yet provide addi- tion information upon closer scrutiny. The data must be logical and uniform, to that end the pond depth data is represented in various shades of blue with darker blues representing deeper areas. Although any color spectrum can be selected, this convention is known and accepted as standard. Due to the wide range of depths between ponds, the same dark blue on Great Quittacas will repre- sent a different depth in the Long Pond image. Depth scales should be studied in each graphic. When all five ponds are displayed on one image, the color scheme is uniform throughout the system. Unless otherwise stated, all measurements are given in feet.
Each of the sections below will display individual pond survey data, one figure will illustrate the mission data retrieved from the AUV's. These black like lines are actu- ally thousands of individual data points containing loca- tion, time, speed, depth, heading, information as well as other parameters. It is this information that is input into
ArcGIS.
After using ArcGIS's Spatial Analyst, the data points were then processed with respect to their individual depth values over the entire path interval. This effectively pro- duces the image shown in the interpolated figures below, which visually represents the ridges and layer trends of the pond floor for a more dynamic interpretation
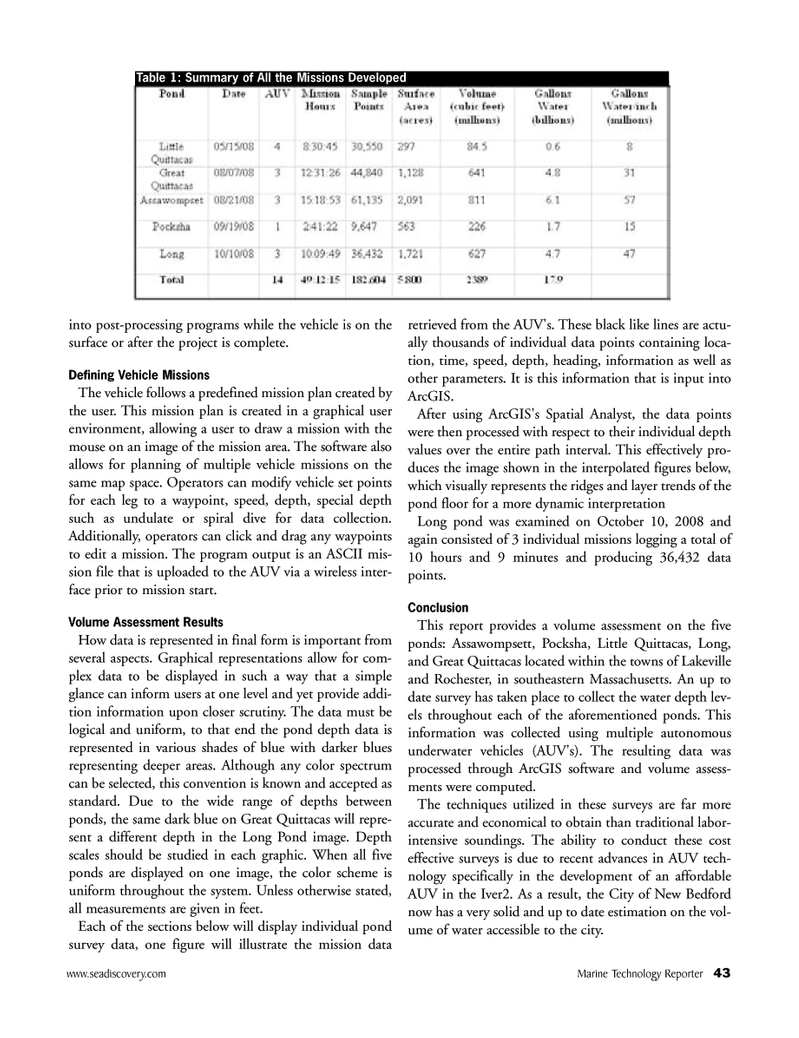
Long pond was examined on October 10, 2008 and again consisted of 3 individual missions logging a total of 10 hours and 9 minutes and producing 36,432 data points.
Conclusion
This report provides a volume assessment on the five ponds: Assawompsett, Pocksha, Little Quittacas, Long, and Great Quittacas located within the towns of Lakeville and Rochester, in southeastern Massachusetts. An up to date survey has taken place to collect the water depth lev- els throughout each of the aforementioned ponds. This information was collected using multiple autonomous underwater vehicles (AUV's). The resulting data was processed through ArcGIS software and volume assess- ments were computed.
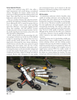
The techniques utilized in these surveys are far more accurate and economical to obtain than traditional labor- intensive soundings. The ability to conduct these cost effective surveys is due to recent advances in AUV tech- nology specifically in the development of an affordable
AUV in the Iver2. As a result, the City of New Bedford now has a very solid and up to date estimation on the vol- ume of water accessible to the city.
Table 1: Summary of All the Missions Developed
MTR#3 (34-49).qxd 3/27/2009 2:33 PM Page 43