
Page 36: of Marine Technology Magazine (June 2019)
Hydrographic Survey: Single & Multibeam Sonar
Read this page in Pdf, Flash or Html5 edition of June 2019 Marine Technology Magazine
 35
35
 37
37
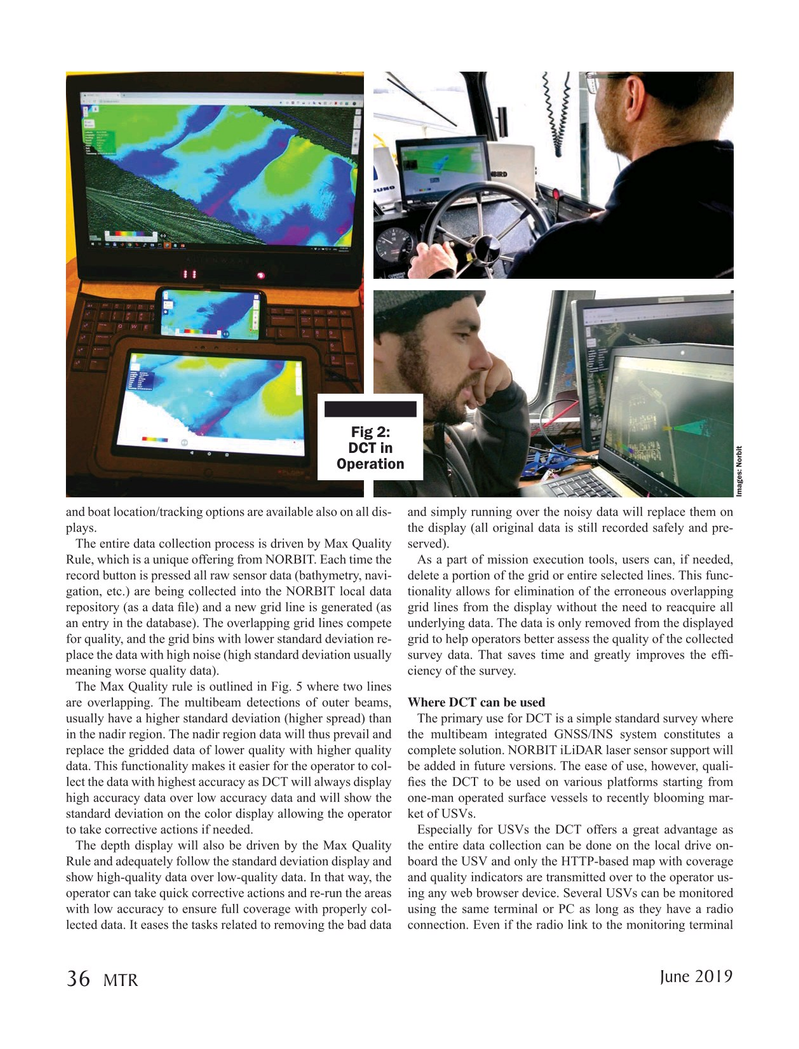
Fig 2:
DCT in
Operation
Images: Norbit and boat location/tracking options are available also on all dis- and simply running over the noisy data will replace them on plays. the display (all original data is still recorded safely and pre-
The entire data collection process is driven by Max Quality served).
Rule, which is a unique offering from NORBIT. Each time the As a part of mission execution tools, users can, if needed, record button is pressed all raw sensor data (bathymetry, navi- delete a portion of the grid or entire selected lines. This func- gation, etc.) are being collected into the NORBIT local data tionality allows for elimination of the erroneous overlapping repository (as a data ? le) and a new grid line is generated (as grid lines from the display without the need to reacquire all an entry in the database). The overlapping grid lines compete underlying data. The data is only removed from the displayed for quality, and the grid bins with lower standard deviation re- grid to help operators better assess the quality of the collected place the data with high noise (high standard deviation usually survey data. That saves time and greatly improves the ef? - meaning worse quality data). ciency of the survey.
The Max Quality rule is outlined in Fig. 5 where two lines are overlapping. The multibeam detections of outer beams, Where DCT can be used usually have a higher standard deviation (higher spread) than The primary use for DCT is a simple standard survey where in the nadir region. The nadir region data will thus prevail and the multibeam integrated GNSS/INS system constitutes a replace the gridded data of lower quality with higher quality complete solution. NORBIT iLiDAR laser sensor support will data. This functionality makes it easier for the operator to col- be added in future versions. The ease of use, however, quali- lect the data with highest accuracy as DCT will always display ? es the DCT to be used on various platforms starting from high accuracy data over low accuracy data and will show the one-man operated surface vessels to recently blooming mar- standard deviation on the color display allowing the operator ket of USVs.
to take corrective actions if needed. Especially for USVs the DCT offers a great advantage as
The depth display will also be driven by the Max Quality the entire data collection can be done on the local drive on-
Rule and adequately follow the standard deviation display and board the USV and only the HTTP-based map with coverage show high-quality data over low-quality data. In that way, the and quality indicators are transmitted over to the operator us- operator can take quick corrective actions and re-run the areas ing any web browser device. Several USVs can be monitored with low accuracy to ensure full coverage with properly col- using the same terminal or PC as long as they have a radio lected data. It eases the tasks related to removing the bad data connection. Even if the radio link to the monitoring terminal
June 2019 36
MTR
MTR #5 (34-49).indd 36 5/24/2019 10:47:20 AM