Page 16: of Maritime Reporter Magazine (December 15, 1970)
Read this page in Pdf, Flash or Html5 edition of December 15, 1970 Maritime Reporter Magazine
 15
15
 17
17
Sun Oil Company's Annual Tanker Report
The 28th Annual Report On The World Tanker Fleet Shows
Liberia Still Leading The World In Carrying Capacity
And Japan The Major Builder Of Tankers By Wide Margin.
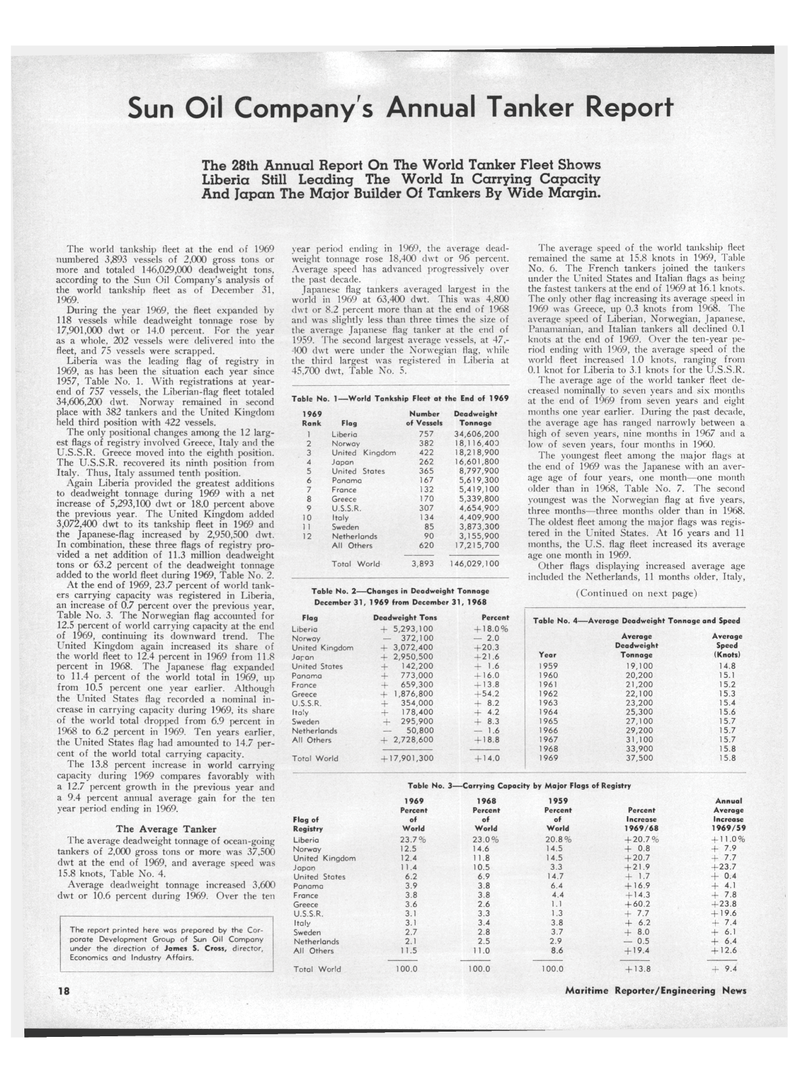
The world tankship fleet at the end of 1969 numbered 3,893 vessels of 2,OCX) gross tons or more and totaled 146,029,000 deadweight tons, according to the Sun Oil Company's analysis of the world tankship fleet as of December 31, 1969.
During the year 1969, the fleet expanded by 118 vessels while deadweight tonnage rose by 17,901,000 dwt or 14.0 percent. For the year as a whole. 202 vessels were delivered into the fleet, and 75 vessels were scrapped.
Liberia was the leading flag of registry in 1969, as has been the situation each year since 1957, Table No. 1. With registrations at year- end of 757 vessels, the Liberian-flag fleet totaled 34,606,200 dwt. Norway remained in second place with 382 tankers and the United Kingdom held third position with 422 vessels.
The only positional changes among the 12 larg- est flags of registry involved Greece, Italy and the
U.S.S.R. Greece moved into the eighth position.
The U.S.S.R. recovered its ninth position from
Italy. Thus, Italy assumed tenth position.
Again Liberia provided the greatest additions to deadweight tonnage during 1969 with a net increase of 5,293,100 dwt or 18.0 percent above the previous year. The United Kingdom added 3,072,400 dwt to its tankship fleet in 1969 and the Japanese-flag increased by 2,950,500 dwt.
In combination, these three flags of registry pro- vided a net addition of 11.3 million deadweight tons or 63.2 percent of the deadweight tonnage added to the world fleet during 1969, Table No. 2.
At the end of 1969, 23.7 percent of world tank- ers carrying capacity was registered in Liberia, an increase of 0.7 percent over the previous year.
Table No. 3. The Norwegian flag accounted for 12.5 percent of world carrying capacity at the end of 1969, continuing its downward trend. The
United Kingdom again increased its share of the world fleet to 12.4 percent in 1969 from 11.8 percent in 1968. The Japanese flag expanded to 11.4 percent of the world total in 1969, up from 10.5 percent one year earlier. Although the United States flag recorded a nominal in- crease in carrying capacity during 1969, its share of the world total dropped from 6.9 percent in 1968 to 6.2 percent in 1969. Ten years earlier, the United States flag had amounted to 14.7 per- cent of the world total carrying capacity.
The 13.8 percent increase in world carrying capacity during 1969 compares favorably with a 12.7 percent growth in the previous year and a 9.4 percent annual average gain for the ten year period ending in 1969.
The Average Tanker
The average deadweight tonnage of ocean-going tankers of 2.000 gross tons or more was 37,500 dwt at the end of 1969, and average speed was 15.8 knots, Table No. 4.
Average deadweight tonnage increased 3.600 dwt or 10.6 percent during 1969. Over the ten
The report printed here wos prepored by the Cor- porate Development Group of Sun Oil Company under the direction of Jemes S. Cross, director.
Economics and Industry Affairs. year period ending in 1969, the average dead- weight tonnage rose 18,400 dwt or 96 percent.
Average speed has advanced progressively over the past decade.
Japanese flag tankers averaged largest in the world in 1969 at 63,400 dwt. This was 4,800 dwt or 8.2 percent more than at the end of 1968 and was slightly less than three times the size of the average Japanese flag tanker at the end of 1959. The second largest average vessels, at 47,- -100 dwt were under the Norwegian flag, while the third largest was registered in Liberia at 45.700 dwt. Table No. 5.
Table No. 1—World Tankship Fleet at the End of 1969 1969 Number Deadweight
Rank Flag of Vessels Tonnage 1 Liberia 757 34,606,200 2 Norway 382 18,1 16,403 3 United Kingdom 422 18,218,900 4 Japan 262 16,601,800 5 United States 365 8,797,900 6 Panama 167 5,619,300 7 France 132 5,419,100 8 Greece 170 5,339,800 9 U.S.S.R. 307 4,654,900 10 Italy 134 4,409,900 1 1 Sweden 85 3,873,300 12 Netherlands 90 3,155,900
All Others 620 17,215,700
Total World 3,893 146,029,100
Table No. 2—Changes in Deadweight Tonnage
December 31, 1969 from December 31, 1968
Flag Deadweight Tons Percent
Liberia + 5,293,100 + 18.0%
Norway — 372,100 — 2.0
United Kingdom + 3,072,400 + 20.3
Jofran + 2,950,500 + 21.6
United States + 142,200 + 1.6
Panama -I- 773,000 + 16.0
France + 659,300 + 13.8
Greece + 1,876,800 + 54.2
U.S.S.R. + 354,000 + 8.2
Italy + 178,400 + 4.2
Sweden + 295,900 + 8.3
Netherlands — 50,800 — 1.6
All Others + 2,728,600 + 18.8
Total World + 17,901,300 + 14.0
The average speed of the world tankship fleet remained the same at 15.8 knots in 1969, Table
No. 6. The French tankers joined the tankers under the United States and Italian flags as being the fastest tankers at the end of 1969 at 16.1 knots.
The only other flag increasing its average speed in 1969 was Greece, up 0.3 knots from 1968. The average sj>eed of Liberian, Norwegian, Japanese,
Panamanian, and Italian tankers all declined 0.1 knots at the end of 1969. Over the ten-year pe- riod ending with 1969, the average speed of the world fleet increased 1.0 knots, ranging from 0.1 knot for Liberia to 3.1 knots for the U.S.S.R.
The average age of the world tanker fleet de- creased nominally to seven years and six months at the end of 1969 from seven years and eight months one year earlier. During the past decade, the average age has ranged narrowly between a high of seven years, nine months in 1967 and a low of seven years, four months in 1960.
The youngest fleet among the major flags at the end of 1969 was the Japanese with an aver- age age of four years, one month—one month older than in 1968, Table No. 7. The second youngest was the Norwegian flag at five years, three months—three months older than in 1968.
The oldest fleet among the major flags was regis- tered in the United States. At 16 years and 11 months, the U.S. flag fleet increased its average age one month in 1969.
Other flags displaying increased average age included the Netherlands, 11 months older, Italy, (Continued on next page)
Table No. 4—Average Deadweight Tonnage and Speed
Average Average
Deadweight Speed
Year Tonnage (Knots) 1959 19,100 14.8 1960 20,200 15.1 1961 21,200 15.2 1962 22,100 15.3 1963 23,200 15.4 1964 25,300 15.6 1965 27,100 15.7 1966 29,200 15.7 1967 31,100 15.7 1968 33,900 15.8 1969 37,500 15.8
Table No. 3—Carrying Capacity by Major Flags of Registry 1969 1968 1959 Annual
Percent Percent Percent Percent Average
Flag of of of of Increase Increase
Registry World World World 1969/68 1969/59
Liberia 23.7% 23.0% 20.8% + 20.7% + 1 1.0%
Norway 12.5 14.6 14.5 + 0.8 + 7.9
United Kingdom 12.4 1 1.8 14.5 + 20.7 + 7.7
Japan 1 1.4 10.5 3.3 + 21.9 + 23.7
United States 6.2 6.9 14.7 + 1.7 + 0.4
Panama 3.9 3.8 6.4 + 16.9 + 4.1
France 3.8 3.8 4.4 + 14.3 + 7.8
Greece 3.6 2.6 1.1 + 60.2 + 23.8
U.S.S.R. 3.1 3.3 1.3 + 7.7 + 19.6
Italy 3.1 3.4 3.8 + 6.2 + 7.4
Sweden 2.7 2.8 3.7 + 8.0 + 6.1
Netherlands 2.1 2.5 2.9 — 0.5 + 6.4
All Others 1 1.5 11.0 8.6 + 19.4 + 12.6
Total World 100.0 100.0 100.0 + 13.8 + 9.4 18 Maritime Reporter/Engineering News
