Page 17: of Maritime Reporter Magazine (December 15, 1970)
Read this page in Pdf, Flash or Html5 edition of December 15, 1970 Maritime Reporter Magazine
ten months older and the U.S.S.R., six months older. Conversely, the Greek flag averaged 37 months younger in 1968, the United Kingdom flag was six months younger and Panama and
France were three months younger.
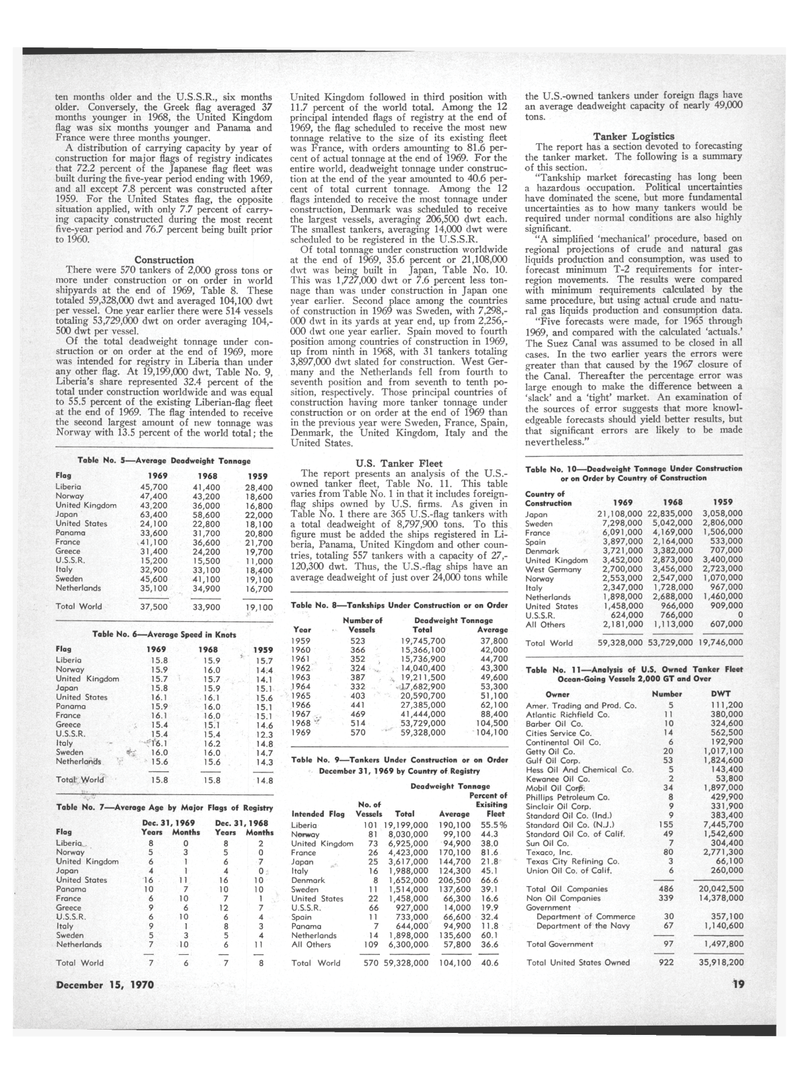
A distribution of carrying capacity by year of construction for major flags of registry indicates that 72.2 percent of the Japanese flag fleet was built during the five-year period ending with 1969, and all except 7.8 percent was constructed after 1959. For the United States flag, the opposite situation applied, with only 7.7 percent of carry- ing capacity constructed during the most recent five-year period and 76.7 percent being built prior to 1960.
Construction
There were 570 tankers of 2,000 gross tons or more under construction or on order in world shipyards at the end of 1969, Table 8. These totaled 59,328,000 dwt and averaged 104,100 dwt per vessel. One year earlier there were 514 vessels totaling 53,729,000 dwt on order averaging 104,- 500 dwt per vessel.
Of the total deadweight tonnage under con- struction or on order at the end of 1969, more was intended for registry in Liberia than under any other flag. At 19,199,000 dwt, Table No. 9,
Liberia's share represented 32.4 percent of the total under construction worldwide and was equal to 55.5 percent of the existing Liberian-flag fleet at the end of 1969. The flag intended to receive the second largest amount of new tonnage was
Norway with 13.5 percent of the world total; the
Table No. 5—Average Deadweight Tonnage
Flag 1969 1968 1959
Liberia 45,700 41,400 28,400
Norway 47,400 43,200 18,600
United Kingdom 43,200 36,000 16,800
Japan 63,400 58,600 22,000
United States 24,100 22,800 18,100
Panama 33,600 31,700 20,800
France 41,100 36,600 21,700
Greece 31,400 24,200 19,700
U.S.S.R. 15,200 15,500 1 1,000
Italy 32,900 33,100 18,400
Sweden 45,600 41,100 19,100
Netherlands 35,100 34,900 16,700
Total World 37,500 33,900 19,100
Table No. 6—Average Speed in Knots
Flag 1969 1968 1959
Liberia 15.8 15.9 15.7
Norway 15.9 16.0 14.4
United Kingdom 15.7 15.7 14.1
Japan 15.8 15.9 15.1
United States 16.1 16.1 15.6
Panama 15.9 16.0 15.1
France 16.1 16.0 15.1
Greece 15.4 15.1 14.6
U.S.S.R. 15.4 15.4 12.3
Italy 16.1 16.2 14.8
Sweden 16.0 16.0 14.7
Netherlands 15.6 15.6 14.3
Totafc World 15.8 15.8 14.8
Table No. 7—Average Age by Major Flags of Registry
Dec. 31 , 1969 Dec. 31 ,1968
Flag Years Months Years Months
Liberia.. 8 0 8 2
Norway 5 3 5 0
United Kingdom 6 1 6 7
Japan 4 1 4 0
United States 16 11 16 10
Panama 10 7 10 10
France 6 10 7 1
Greece 9 6 12 7
U.S.S.R. 6 10 6 4
Italy 9 1 8 3
Sweden 5 3 5 4
Netherlands 7 10 6 1 1
Total World 7 6 7 8
United Kingdom followed in third position with 11.7 percent of the world total. Among the 12 principal intended flags of registry at the end of 1969, the flag scheduled to receive the most new tonnage relative to the size of its existing fleet was France, with orders amounting to 81.6 per- cent of actual tonnage at the end of 1969. For the entire world, deadweight tonnage under construc- tion at the end of the year amounted to 40.6 per- cent of total current tonnage. Among the 12 flags intended to receive the most tonnage under construction, Denmark was scheduled to receive the largest vessels, averaging 206,500 dwt each.
The smallest tankers, averaging 14,000 dwt were scheduled to be registered in the U.S.S.R.
Of total tonnage under construction worldwide at the end of 1969, 35.6 percent or 21,108,000 dwt was being built in Japan, Table No. 10.
This was 1,727,000 dwt or 7.6 percent less ton- nage than was under construction in Japan one year earlier. Second place among the countries of construction in 1969 was Sweden, with 7,298,- 000 dwt in its yards at year end, up from 2,256,- 000 dwt one year earlier. Spain moved to fourth position among countries of construction in 1969, up from ninth in 1968, with 31 tankers totaling 3,897,000 dwt slated for construction. West Ger- many and the Netherlands fell from fourth to seventh position and from seventh to tenth po- sition, respectively. Those principal countries of construction having more tanker tonnage under construction or on order at the end of 1969 than in the previous year were Sweden, France, Spain,
Denmark, the United Kingdom, Italy and the
United States. the U.S.-owned tankers under foreign flags have an average deadweight capacity of nearly 49,000 tons.
Tanker Logistics
The report has a section devoted to forecasting the tanker market. The following is a summary of this section. "Tankship market forecasting has long been a hazardous occupation. Political uncertainties have dominated the scene, but more fundamental uncertainties as to how many tankers would be required under normal conditions are also highly significant. "A simplified 'mechanical' procedure, based on regional projections of crude and natural gas liquids production and consumption, was used to forecast minimum T-2 requirements for inter- region movements. The results were compared with minimum requirements calculated by the same procedure, but using actual crude and natu- ral gas liquids production and consumption data. "Five forecasts were made, for 1965 through 1969, and compared with the calculated 'actuals.'
The Suez Canal was assumed to be closed in all cases. In the two earlier years the errors were greater than that caused by the 1967 closure of the Canal. Thereafter the percentage error was large enough to make the difference between a 'slack' and a 'tight' market. An examination of the sources of error suggests that more knowl- edgeable forecasts should yield better results, but that significant errors are likely to be made nevertheless."
U.S. Tanker Fleet
The report presents an analysis of the U.S.- owned tanker fleet, Table No. 11. This table varies from Table No. 1 in that it includes foreign- flag ships owned by U.S. firms. As given in
Table No. 1 there are 365 U.S.-flag tankers with a total deadweight of 8,797,900 tons. To this figure must be added the ships registered in Li- beria, Panama, United Kingdom and other coun- tries, totaling 557 tankers with a capacity of 27,- 120,300 dwt. Thus, the U.S.-flag ships have an average deadweight of just over 24,000 tons while
Table No. 8—Tankships Under Construction or on Order
Number of Deadweight Tonnage
Year • Vessels Total Average 1959 523 19,745,700 37,800 1960 366 15,366,100 42,000 1961 352 15,736,900 44,700 1962 324 14,040,400 43,300 1963 387 19,211,500 49,600 1964 332 wj»7,682,900 53,300 1965 403 20,590,700 51,100 1966 441 27,385,000 62,100 1967 „ 469 41,444,000 88,400 1 968 ** 514 53,729,000 104,500 1969 570 ^ 59,328,000 104,100
Table No. 9—Tankers Under Construction or on Order
December 31, 1969 by Country of Registry
Deadweight Tonnage
Percent of
No. of Exisiting
Intended Flag Vessels Total Average Fleet
Liberia 101 19,199,000 190,100 55.5%
Norway 81 8,030,000 99,100 44.3
United Kingdom 73 6,925,000 94,900 38.0
France 26 4,423,000 170,100 81.6
Japan 25 3,617,000 144,700 21.8
Italy 16 1,988,000 124,300 45.1
Denmark 8 1,652,000 206,500 66.6
Sweden 11 1,514,000 137,600 39.1
United States 22 1,458,000 66,300 16.6
U.S.S.R. 66 927,000 14,000 19.9
Spain 1 1 733,000 66,600 32.4
Panama 7 644,000 94,900 11.8
Netherlands 14 1,898,000 135,600 60.1
All Others 109 6,300,000 57,800 36.6
Total World 570 59,328,000 104,100 40.6
Table No. 10—Deadweight Tonnage Under Construction or on Order by Country of Construction
Country of
Construction 1969 1968 1959
Japan 21,108,000 22,835,000 3,058,000
Sweden 7,298,000 5,042,000 2,806,000
France 6,091,000 4,169,000 1,506,000
Spain 3,897,000 2,164,000 533,000
Denmark 3,721,000 3,382,000 707,000
United Kingdom 3,452,000 2,873,000 3,400,000
West Germany 2,700,000 3,456,000 2,723,000
Norway 2,553,000 2,547,000 1,070,000
Italy 2,347,000 1,728,000 967,000
Netherlands 1,898,000 2,688,000 1,460,000
United States 1,458,000 966,000 909,000
U.S.S.R. 624,000 766,000 0
All Others 2,181,000 1,113,000 607,000
Total World 59,328,000 53,729,000 19,746,000
Table No. 11—Analysis of U.S. Owned Tanker Fleet
Ocean-Going Vessels 2,000 GT and Over
Owner Number DWT
Amer. Trading and Prod. Co. 5 111,200
Atlantic Richfield Co. 1 1 380,000
Barber Oil Co. 10 324,600
Cities Service Co. 14 562,500
Continental Oil Co. 6 192,900
Getty Oil Co. 20 1,017,100
Gulf Oil Corp. 53 1,824,600
Hess Oil And Chemical Co. 5 143,400
Kewanee Oil Co. 2 53,800
Mobil Oil Coif. 34 1,897,000
Phillips Petroleum Co. 8 429,900
Sinclair Oil Corp. 9 331,900
Standard Oil Co. (Ind.) 9 383,400
Standard Oil Co. (N.J.) 155 7,445,700
Standard Oil Co. of Calif. 49 1,542,600
Sun Oil Co. 7 304,400
Texaco, Inc. 80 2,771,300
Texas City Refining Co. 3 66,100
Union Oil Co. of Calif. 6 260,000
Total Oil Companies 486 20,042,500
Non Oil Companies 339 14,378,000
Government
Department of Commerce 30 357,100
Department of the Navy 67 1,140,600
Total Government 97 1,497,800
Total United States Owned 922 35,918,200
December 15, 1970 19

 16
16

 18
18
