
Page 69: of Maritime Reporter Magazine (June 2011)
Feature: Annual World Yearbook
Read this page in Pdf, Flash or Html5 edition of June 2011 Maritime Reporter Magazine
 68
68
 70
70
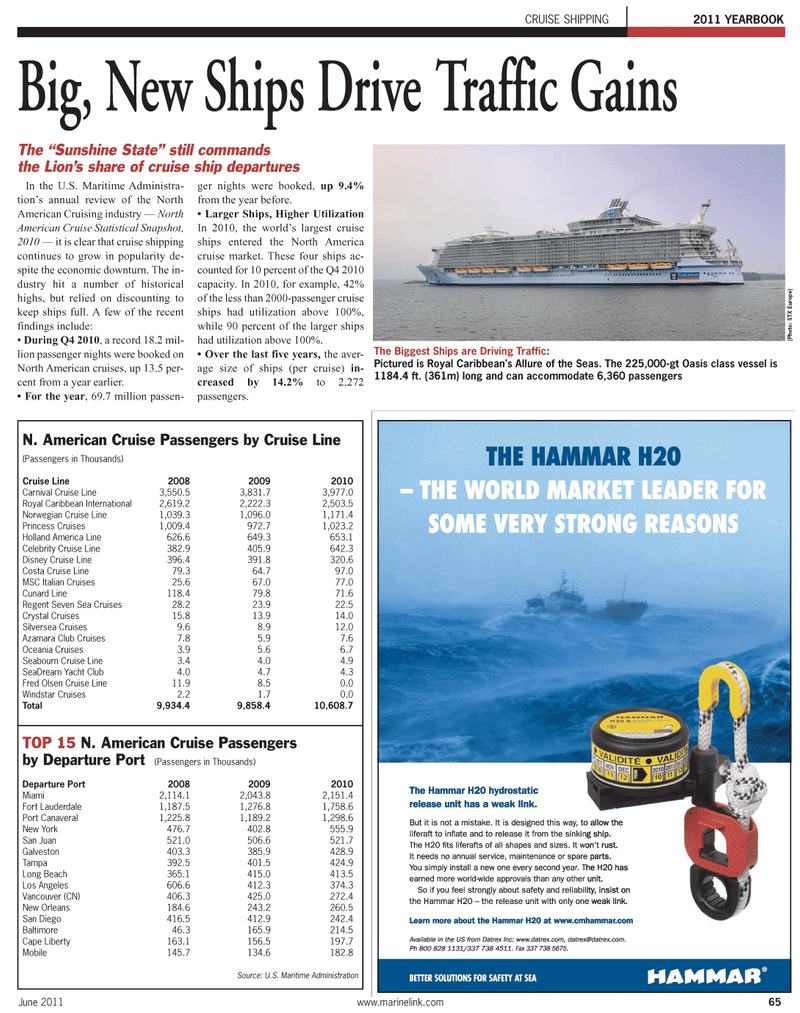
In the U.S. Maritime Administra- tions annual review of the North American Cruising industry ? NorthAmerican Cruise Statistical Snapshot,2010 ? it is clear that cruise shippingcontinues to grow in popularity de- spite the economic downturn. The in- dustry hit a number of historicalhighs, but relied on discounting to keep ships full. A few of the recent findings include: ? During Q4 2010, a record 18.2 mil-lion passenger nights were booked on North American cruises, up 13.5 per- cent from a year earlier. ? For the year , 69.7 million passen-ger nights were booked, up 9.4%from the year before.? Larger Ships, Higher Utilization In 2010, the worlds largest cruise ships entered the North America cruise market. These four ships ac- counted for 10 percent of the Q4 2010capacity. In 2010, for example, 42% of the less than 2000-passenger cruiseships had utilization above 100%, while 90 percent of the larger ships had utilization above 100%. ? Over the last five years, the aver- age size of ships (per cruise) in-creased by 14.2% to 2,272passengers. June 2011www.marinelink.com 652011 YEARBOOKCRUISE SHIPPINGBig, New Ships Drive Traffic Gains The Biggest Ships are Driving Traffic : Pictured is Royal Caribbean's Allure of the Seas. The 225,000-gt Oasis class vessel is 1184.4 ft. (361m) long and can accommodate 6,360 passengers N. American Cruise Passengers by Cruise Line(Passengers in Thousands)Cruise Line200820092010 Carnival Cruise Line3,550.53,831.73,977.0 Royal Caribbean International2,619.22,222.32,503.5 Norwegian Cruise Line1,039.31,096.01,171.4 Princess Cruises1,009.4972.71,023.2 Holland America Line626.6649.3653.1 Celebrity Cruise Line382.9405.9642.3 Disney Cruise Line396.4391.8320.6 Costa Cruise Line79.364.797.0 MSC Italian Cruises25.667.077.0 Cunard Line118.479.871.6 Regent Seven Sea Cruises28.223.922.5 Crystal Cruises15.813.914.0 Silversea Cruises9.68.912.0 Azamara Club Cruises7.85.97.6 Oceania Cruises3.95.66.7 Seabourn Cruise Line3.44.04.9 SeaDream Yacht Club4.04.74.3 Fred Olsen Cruise Line11.98.50.0 Windstar Cruises2.21.70.0 Total9,934.49,858.410,608.7 TOP 15N. American Cruise Passengers by Departure Port (Passengers in Thousands)Departure Port200820092010 Miami2,114.12,043.82,151.4 Fort Lauderdale1,187.51,276.81,758.6 Port Canaveral1,225.81,189.21,298.6 New York476.7402.8555.9 San Juan521.0506.6521.7 Galveston403.3385.9428.9 Tampa392.5401.5424.9 Long Beach365.1415.0413.5 Los Angeles606.6412.3374.3 Vancouver (CN)406.3425.0272.4 New Orleans184.6243.2260.5 San Diego416.5412.9242.4 Baltimore46.3165.9214.5 Cape Liberty163.1156.5197.7 Mobile145.7134.6182.8 Source: U.S. Maritime Administration The Sunshine State? still commands the Lions share of cruise ship departures (Photo: STX Europe)
