Page 39: of Maritime Reporter Magazine (April 2014)
Offshore Edition
Read this page in Pdf, Flash or Html5 edition of April 2014 Maritime Reporter Magazine
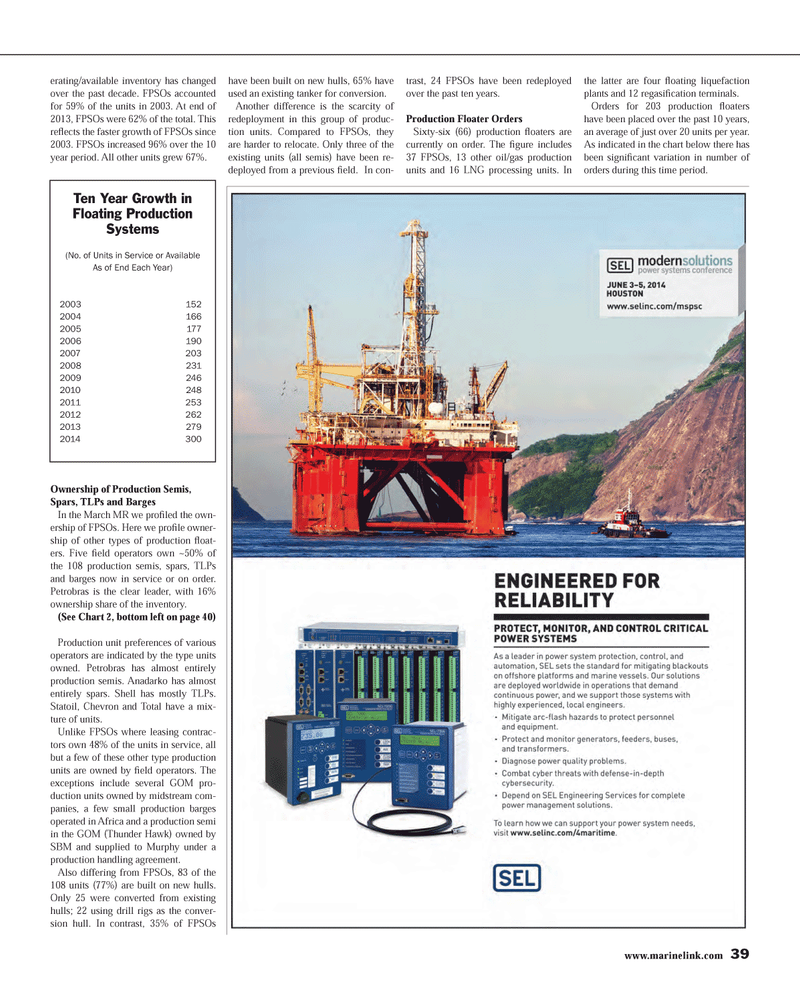
erating/available inventory has changed over the past decade. FPSOs accounted for 59% of the units in 2003. At end of 2013, FPSOs were 62% of the total. This reß ects the faster growth of FPSOs since 2003. FPSOs increased 96% over the 10 year period. All other units grew 67%. Ownership of Production Semis, Spars, TLPs and Barges In the March MR we proÞ led the own- ership of FPSOs. Here we proÞ le owner- ship of other types of production ß oat-ers. Five Þ eld operators own ~50% of the 108 production semis, spars, TLPs and barges now in service or on order. Petrobras is the clear leader, with 16% ownership share of the inventory. (See Chart 2, bottom left on page 40)Production unit preferences of various operators are indicated by the type units owned. Petrobras has almost entirely production semis. Anadarko has almost entirely spars. Shell has mostly TLPs. Statoil, Chevron and Total have a mix- ture of units.Unlike FPSOs where leasing contrac-tors own 48% of the units in service, all but a few of these other type production units are owned by Þ eld operators. The exceptions include several GOM pro-duction units owned by midstream com-panies, a few small production barges operated in Africa and a production semi in the GOM (Thunder Hawk) owned by SBM and supplied to Murphy under a production handling agreement. Also differing from FPSOs, 83 of the 108 units (77%) are built on new hulls. Only 25 were converted from existing hulls; 22 using drill rigs as the conver- sion hull. In contrast, 35% of FPSOs have been built on new hulls, 65% have used an existing tanker for conversion.Another difference is the scarcity of redeployment in this group of produc-tion units. Compared to FPSOs, they are harder to relocate. Only three of the existing units (all semis) have been re-deployed from a previous Þ eld. In con- trast, 24 FPSOs have been redeployed over the past ten years.Production Floater Orders Sixty-six (66) production ß oaters are currently on order. The Þ gure includes 37 FPSOs, 13 other oil/gas production units and 16 LNG processing units. In the latter are four ß oating liquefaction plants and 12 regasiÞ cation terminals. Orders for 203 production ß oaters have been placed over the past 10 years, an average of just over 20 units per year. As indicated in the chart below there has been signiÞ cant variation in number of orders during this time period.www.marinelink.com 39Ten Year Growth in Floating Production Systems(No. of Units in Service or Available As of End Each Year) 2003 152 2004 166 2005 177 2006 190 2007 203 2008 231 2009 246 2010 248 2011 253 2012 262 2013 279 2014 300 MR #4 (34-41).indd 39MR #4 (34-41).indd 394/5/2014 3:13:52 PM4/5/2014 3:13:52 PM

 38
38

 40
40
