
Page 40: of Maritime Reporter Magazine (April 2014)
Offshore Edition
Read this page in Pdf, Flash or Html5 edition of April 2014 Maritime Reporter Magazine
 39
39
 41
41
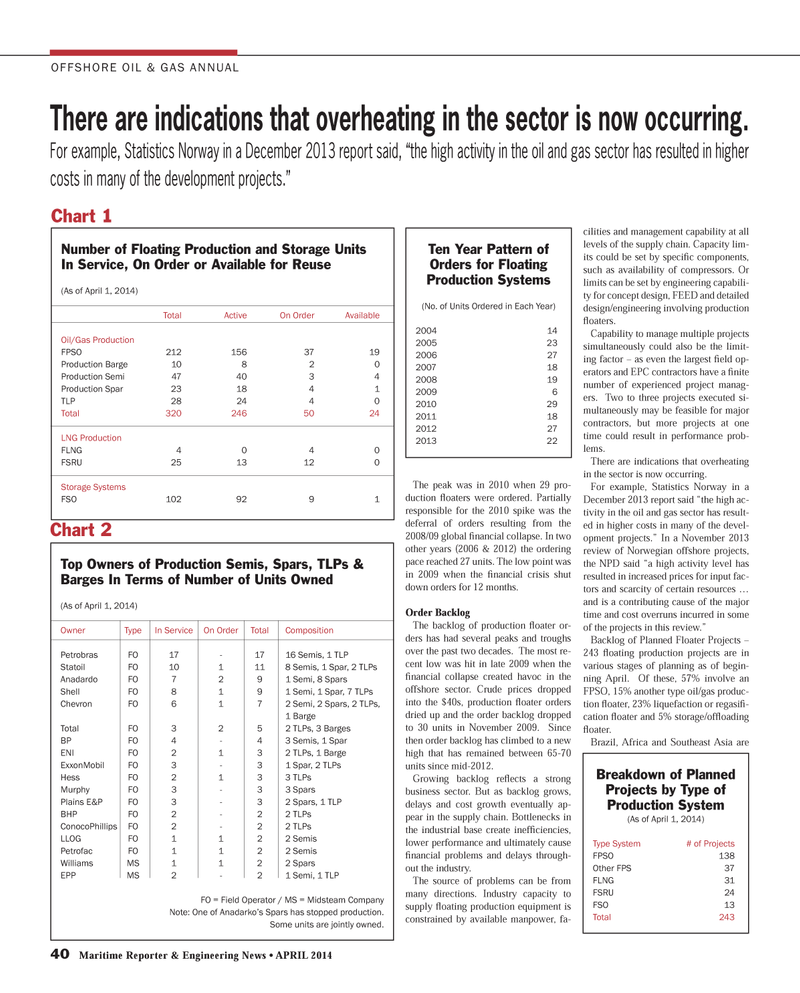
40 Maritime Reporter & Engineering News ? APRIL 2014 The peak was in 2010 when 29 pro-duction ß oaters were ordered. Partially responsible for the 2010 spike was the deferral of orders resulting from the 2008/09 global Þ nancial collapse. In two other years (2006 & 2012) the ordering pace reached 27 units. The low point was in 2009 when the Þ nancial crisis shut down orders for 12 months.Order Backlog The backlog of production ß oater or- ders has had several peaks and troughs over the past two decades. The most re- cent low was hit in late 2009 when the Þ nancial collapse created havoc in the offshore sector. Crude prices dropped into the $40s, production ß oater orders dried up and the order backlog dropped to 30 units in November 2009. Since then order backlog has climbed to a new high that has remained between 65-70 units since mid-2012. Growing backlog reß ects a strong business sector. But as backlog grows, delays and cost growth eventually ap-pear in the supply chain. Bottlenecks in the industrial base create inefÞ ciencies, lower performance and ultimately cause Þ nancial problems and delays through- out the industry. The source of problems can be from many directions. Industry capacity to supply ß oating production equipment is constrained by available manpower, fa- cilities and management capability at all levels of the supply chain. Capacity lim-its could be set by speciÞ c components, such as availability of compressors. Or limits can be set by engineering capabili-ty for concept design, FEED and detailed design/engineering involving production ß oaters. Capability to manage multiple projects simultaneously could also be the limit-ing factor ? as even the largest Þ eld op- erators and EPC contractors have a Þ nite number of experienced project manag-ers. Two to three projects executed si- multaneously may be feasible for major contractors, but more projects at one time could result in performance prob-lems. There are indications that overheating in the sector is now occurring. For example, Statistics Norway in a December 2013 report said ?the high ac-tivity in the oil and gas sector has result-ed in higher costs in many of the devel-opment projects.? In a November 2013 review of Norwegian offshore projects, the NPD said ?a high activity level has resulted in increased prices for input fac-tors and scarcity of certain resources ? and is a contributing cause of the major time and cost overruns incurred in some of the projects in this review.? Backlog of Planned Floater Projects ? 243 ß oating production projects are in various stages of planning as of begin-ning April. Of these, 57% involve an FPSO, 15% another type oil/gas produc-tion ß oater, 23% liquefaction or regasi Þ -cation ß oater and 5% storage/of ß oading ß oater. Brazil, Africa and Southeast Asia are OFFSHORE OIL & GAS ANNUAL There are indications that overheating in the sector is now occurring. For example, Statistics Norway in a December 2013 report said, ?the high activity in the oil and gas sector has resulted in hig her costs in many of the development projects.? Number of Floating Production and Storage Units In Service, On Order or Available for Reuse (As of April 1, 2014) Total Active On Order Available Oil/Gas ProductionFPSO 212 156 37 19 Production Barge 10 8 2 0 Production Semi 47 40 3 4Production Spar 23 18 4 1TLP 28 24 4 0 Total 320 246 50 24 LNG ProductionFLNG 4 0 4 0 FSRU 25 13 12 0 Storage Systems FSO 102 92 9 1 Top Owners of Production Semis, Spars, TLPs & Barges In Terms of Number of Units Owned (As of April 1, 2014) Owner Type In Service On Order Total Composition Petrobras FO 17 - 17 16 Semis, 1 TLP Statoil FO 10 1 11 8 Semis, 1 Spar, 2 TLPs Anadardo FO 7 2 9 1 Semi, 8 Spars Shell FO 8 1 9 1 Semi, 1 Spar, 7 TLPs Chevron FO 6 1 7 2 Semi, 2 Spars, 2 TLPs, 1 BargeTotal FO 3 2 5 2 TLPs, 3 Barges BP FO 4 - 4 3 Semis, 1 Spar ENI FO 2 1 3 2 TLPs, 1 Barge ExxonMobil FO 3 - 3 1 Spar, 2 TLPs Hess FO 2 1 3 3 TLPs Murphy FO 3 - 3 3 Spars Plains E&P FO 3 - 3 2 Spars, 1 TLP BHP FO 2 - 2 2 TLPsConocoPhillips FO 2 - 2 2 TLPs LLOG FO 1 1 2 2 Semis Petrofac FO 1 1 2 2 Semis Williams MS 1 1 2 2 Spars EPP MS 2 - 2 1 Semi, 1 TLP FO = Field Operator / MS = Midsteam Company Note: One of Anadarko?s Spars has stopped production. Some units are jointly owned. Chart 1Chart 2Ten Year Pattern of Orders for Floating Production Systems (No. of Units Ordered in Each Year) 2004 14 2005 232006 27 2007 18 2008 19 2009 62010 29 2011 18 2012 27 2013 22 Breakdown of Planned Projects by Type of Production System (As of April 1, 2014) Type System # of Projects FPSO 138 Other FPS 37 FLNG 31 FSRU 24 FSO 13 Total 243 MR #4 (34-41).indd 40MR #4 (34-41).indd 404/4/2014 11:16:37 AM4/4/2014 11:16:37 AM
