
Page 55: of Maritime Reporter Magazine (June 2014)
Annual World Yearbook
Read this page in Pdf, Flash or Html5 edition of June 2014 Maritime Reporter Magazine
 54
54
 56
56
www.marinelink.com 55
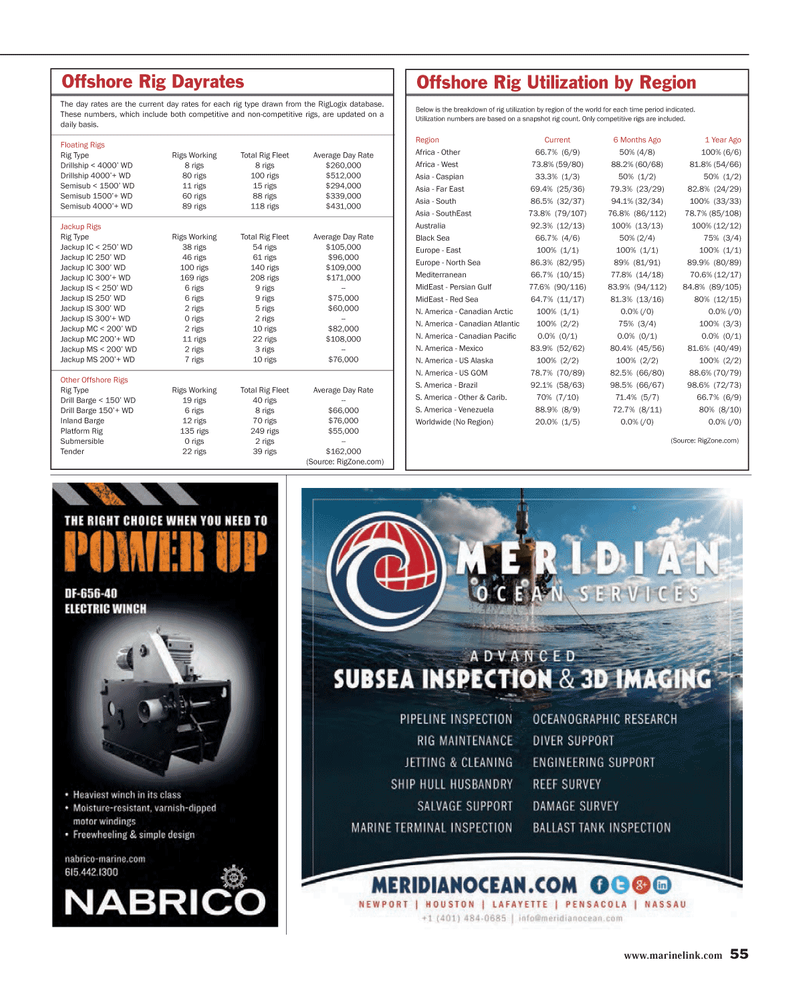
The day rates are the current day rates for each rig type drawn from the RigLogix database.
These numbers, which include both competitive and non-competitive rigs, are updated on a daily basis.
Floating Rigs
Rig Type Rigs Working Total Rig Fleet Average Day Rate
Drillship < 4000’ WD 8 rigs 8 rigs $260,000
Drillship 4000’+ WD 80 rigs 100 rigs $512,000
Semisub < 1500’ WD 11 rigs 15 rigs $294,000
Semisub 1500’+ WD 60 rigs 88 rigs $339,000
Semisub 4000’+ WD 89 rigs 118 rigs $431,000
Jackup Rigs
Rig Type Rigs Working Total Rig Fleet Average Day Rate
Jackup IC < 250’ WD 38 rigs 54 rigs $105,000
Jackup IC 250’ WD 46 rigs 61 rigs $96,000
Jackup IC 300’ WD 100 rigs 140 rigs $109,000
Jackup IC 300’+ WD 169 rigs 208 rigs $171,000
Jackup IS < 250’ WD 6 rigs 9 rigs --
Jackup IS 250’ WD 6 rigs 9 rigs $75,000
Jackup IS 300’ WD 2 rigs 5 rigs $60,000
Jackup IS 300’+ WD 0 rigs 2 rigs --
Jackup MC < 200’ WD 2 rigs 10 rigs $82,000
Jackup MC 200’+ WD 11 rigs 22 rigs $108,000
Jackup MS < 200’ WD 2 rigs 3 rigs --
Jackup MS 200’+ WD 7 rigs 10 rigs $76,000
Other Offshore Rigs
Rig Type Rigs Working Total Rig Fleet Average Day Rate
Drill Barge < 150’ WD 19 rigs 40 rigs --
Drill Barge 150’+ WD 6 rigs 8 rigs $66,000
Inland Barge 12 rigs 70 rigs $76,000
Platform Rig 135 rigs 249 rigs $55,000
Submersible 0 rigs 2 rigs --
Tender 22 rigs 39 rigs $162,000 (Source: RigZone.com)
Offshore Rig Dayrates
Below is the breakdown of rig utilization by region of the world for each time period indicated.
Utilization numbers are based on a snapshot rig count. Only competitive rigs are included.
Region Current 6 Months Ago 1 Year Ago
Africa - Other 66.7% (6/9) 50% (4/8) 100% (6/6)
Africa - West 73.8% (59/80) 88.2% (60/68) 81.8% (54/66)
Asia - Caspian 33.3% (1/3) 50% (1/2) 50% (1/2)
Asia - Far East 69.4% (25/36) 79.3% (23/29) 82.8% (24/29)
Asia - South 86.5% (32/37) 94.1% (32/34) 100% (33/33)
Asia - SouthEast 73.8% (79/107) 76.8% (86/112) 78.7% (85/108)
Australia 92.3% (12/13) 100% (13/13) 100% (12/12)
Black Sea 66.7% (4/6) 50% (2/4) 75% (3/4)
Europe - East 100% (1/1) 100% (1/1) 100% (1/1)
Europe - North Sea 86.3% (82/95) 89% (81/91) 89.9% (80/89)
Mediterranean 66.7% (10/15) 77.8% (14/18) 70.6% (12/17)
MidEast - Persian Gulf 77.6% (90/116) 83.9% (94/112) 84.8% (89/105)
MidEast - Red Sea 64.7% (11/17) 81.3% (13/16) 80% (12/15)
N. America - Canadian Arctic 100% (1/1) 0.0% (/0) 0.0% (/0)
N. America - Canadian Atlantic 100% (2/2) 75% (3/4) 100% (3/3)
N. America - Canadian Pacifi c 0.0% (0/1) 0.0% (0/1) 0.0% (0/1)
N. America - Mexico 83.9% (52/62) 80.4% (45/56) 81.6% (40/49)
N. America - US Alaska 100% (2/2) 100% (2/2) 100% (2/2)
N. America - US GOM 78.7% (70/89) 82.5% (66/80) 88.6% (70/79)
S. America - Brazil 92.1% (58/63) 98.5% (66/67) 98.6% (72/73)
S. America - Other & Carib. 70% (7/10) 71.4% (5/7) 66.7% (6/9)
S. America - Venezuela 88.9% (8/9) 72.7% (8/11) 80% (8/10)
Worldwide (No Region) 20.0% (1/5) 0.0% (/0) 0.0% (/0) (Source: RigZone.com)
Offshore Rig Utilization by Region
MR #6 (50-57).indd 55 6/11/2014 2:45:58 PM
