
Page 23: of Offshore Engineer Magazine (Oct/Nov 2014)
Read this page in Pdf, Flash or Html5 edition of Oct/Nov 2014 Offshore Engineer Magazine
 22
22
 24
24
director, global imaging sales, explains TGS’s work on visual- and geological objectives of the area is always benefcial, but ization technology development. the proper handling of the data during time preprocessing (e.g., de-noise, de-multiple, broadband processing, regularization)
OE: Could you tell us what visualization software and is critical to optimizing the quality of the data for both imag- depth imaging technology you use for pre-salt formations?
ing and visualization. The visualization software would not
PGS : The key visualization tool used to construct our depth optimize the acquisition data quality, but properly acquired and imaging velocity models is a proprietary product called PGS processed data would look better through all stages of imaging holoSeis, which is developed and maintained by our in-house and interpretation.
software group. In addition, PGS holoSeis is the front-end to
OE: How do the technologies work, what algorithms and accompanying technologies such as the PGS hyperBeam plat- inversions do you use?
form that can deliver rapid cycle depth imaging using our Beam
PGS imaging algorithm. : PGS holoSeis does not contain processing or inversion : The Petrel E&P software platform enables 3D and 2D algorithms beyond simple functions such as attribute smooth-
SLB visualization of any geological information, including pre-salt ing, editing and QC analysis. It does, however, integrate into formations. the wider PGS processing package where all the algorithms : TGS uses PRIMA software for time processing, visu- required for seismic processing, imaging and inversion reside.
TGS alization and interpretation, and ImageZ software contains As datasets become ever larger, it is no longer effcient to pro- the tomography and migration algorithms used during depth cess using desktop workstations and therefore the batch algo- imaging. Both of these packages are TGS proprietary software. rithms are optimized for cluster technology, allowing the user’s
A module known as PrimaViz provides full 3D workstation desktop to focus on visualization demands only. However, visualization and interpretation capabilities. seamless integration between data visualization and batch processing is essential and PGS hyperBeam is the ultimate cul-
OE: How does the quality of seismic acquisition afect mination of that integration effort.
: There are various algorithms and inversion processes
SLB visualization and does the visualization software optimize used to enhance the image in this environment. Using a com- the seismic acquisition data quality?
PGS: Visualization is not affected by the quality of seismic bination of seismic attributes, such as spectral or structural acquisition, however, good visualization tools can better deter- decomposition, based on unique edge detection attributes, users mine the quality of data acquired and processed. The exception can blend results and visualize geological features more clearly. to the above statement is in today’s ever demanding environ- Using pre-stack data, in context, within the same environment ment of data acquisition where data volumes are increasing rap- as interpretation is undertaken, enables asset teams to get the idly and where multiple data gathering programs are conducted most out of their seismic by looking directly at the source data. over the same feld prospect. Integrating all this data into one For example, by stacking on the fy and visualizing in 2D and “seamless” experience is a huge challenge. 3D simultaneously. users can discretize the noise and remove it
SLB: The quality and type of the seismic data acquired infu- to enhance the image.
TGS ence the visualization of a geological object, especially in a : Specifc to imaging around salt, the technologies complex salt environment. The Petrel platform allows users to applied during imaging and visualization would be using the load and visualize any seismic data type. It features processes optimal anisotropic depth imaging and migration approaches
Photo from Schlumberger.
Test image of Petrel structural modeling. to clean the signal and extract crucial seismic measurements that solve the imaging problems specifc to any given data- directly into the project, such as seismic attribute and post set. Approaches throughout the depth model building and and pre-stack processing tools. This helps enhance the image fnal migration stages normally include titled transverse beneath the salt and accurately delineate salt boundaries. isotropic modeling, dip guided or image guided tomogra-
TGS : Receiving seismic data that was acquired with acquisition phy, TTI Kirchhoff, TTI reverse time migration (RTM), and parameters suited for the geophysical (e.g. correct sampling, potentially TTI beam migration. Subsalt updating via RTM good signal to noise ratio, proper fold, suffcient bandwidth) delayed image time analysis (DIT) is also used. Orthorhombic
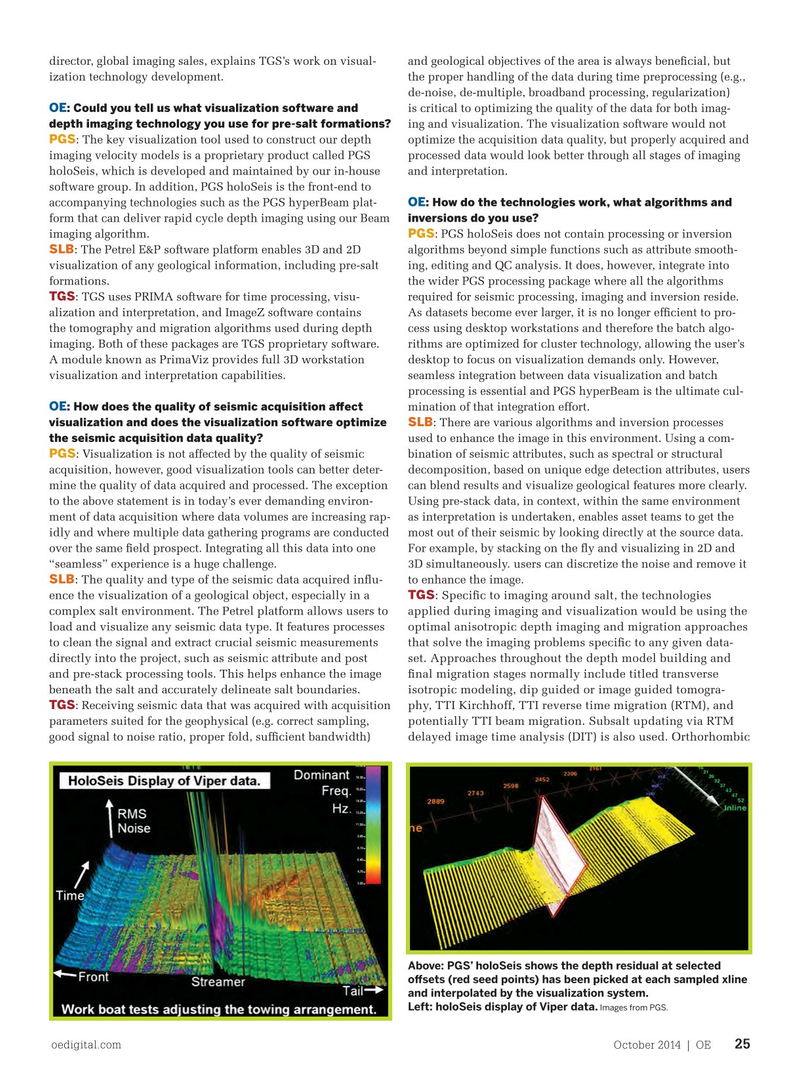
Above: PGS’ holoSeis shows the depth residual at selected ofsets (red seed points) has been picked at each sampled xline and interpolated by the visualization system.
Left: holoSeis display of Viper data. Images from PGS.
oedigital.com October 2014 | OE 25 000_1014_OE_Viz1.indd 25 9/23/14 11:02 AM