
Page 24: of Offshore Engineer Magazine (Oct/Nov 2014)
Read this page in Pdf, Flash or Html5 edition of Oct/Nov 2014 Offshore Engineer Magazine
 23
23
 25
25
complex geologic areas with steep
VISUALIZATION TECHNOLOGY dips, both the pre-salt sediments and sub-salt are better imaged. Image- guided tomography provides a more stable, structurally consistent velocity depth model. DIT is used to tune the image both at the salt base and in the sediments below. Orthorhombic mod- eling and migration may be used in the more complex areas that exhibit azimuthal anisotropy (fracture and stress zones).
OE: How long have you been using
Left: Angola, Velocity update from Image Guided tomography. Right: Angola, Velocity these visualization technologies update from conventional tomography.
Images from TGS.
and can you give us example(s) of pre-salt felds where the technol- ogy was used?
PGS: PGS holoSeis has been used for over a decade to visualize data in all hydrocarbon-bearing regimes in the world, onshore and offshore.
Recently, Brazil, Gulf of Mexico and West Africa have seen the most consistent and concerted exploration activity and successes, but not with- out their own imaging challenges.
PGS works for all major oil compa- nies and have visualized data from all producing oil provinces and frontier exploration areas.
SLB: It has been in use for more than fve years. The Petrel platform is used
ONLY ONE in the Gulf of Mexico, offshore Brazil,
BOLTING SYSTEM
Angola, and the Barents Sea, as well as in onshore projects in North Africa
IMPROVES and Europe for depth imaging studies
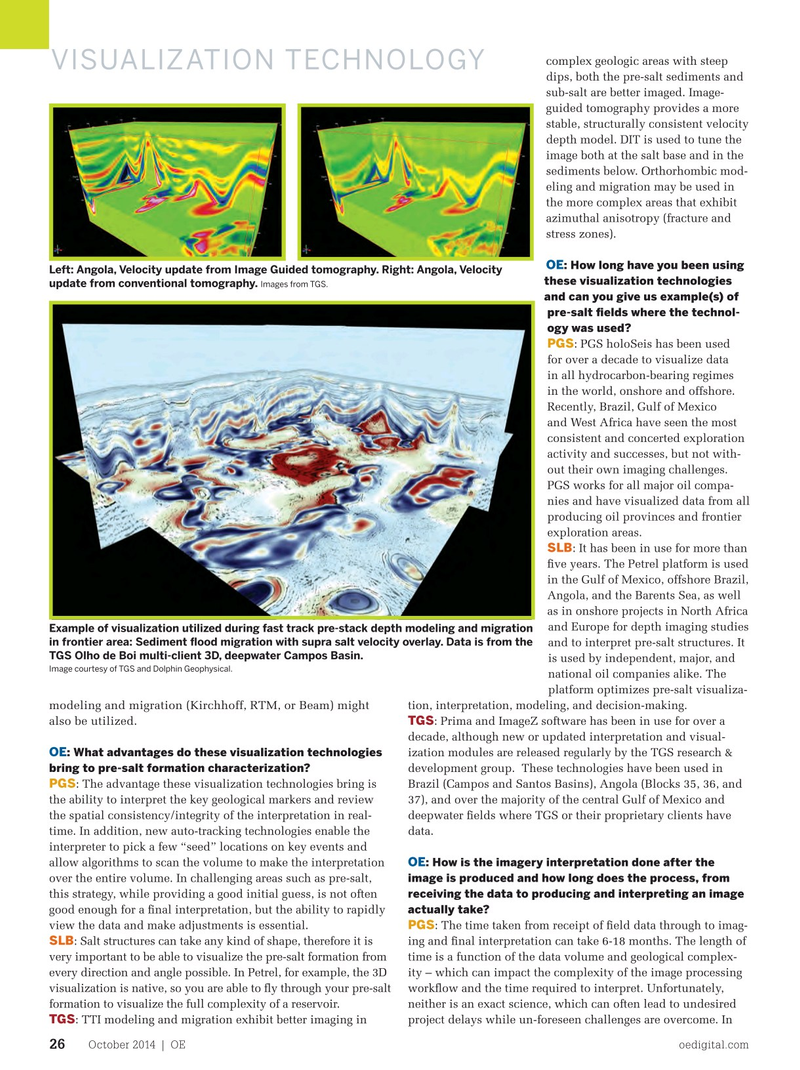
Example of visualization utilized during fast track pre-stack depth modeling and migration
SAFETY, QUALITY, in frontier area: Sediment food migration with supra salt velocity overlay. Data is from the and to interpret pre-salt structures. It
TGS Olho de Boi multi-client 3D, deepwater Campos Basin. is used by independent, major, and & SCHEDULE
Image courtesy of TGS and Dolphin Geophysical. national oil companies alike. The
FOR BLOWOUT platform optimizes pre-salt visualiza- modeling and migration (Kirchhoff, RTM, or Beam) might tion, interpretation, modeling, and decision-making.
PREVENTER
TGS: Prima and ImageZ software has been in use for over a also be utilized.
decade, although new or updated interpretation and visual-
MAINTENANCE
OE: What advantages do these visualization technologies ization modules are released regularly by the TGS research & bring to pre-salt formation characterization?
development group. These technologies have been used in
PGS: The advantage these visualization technologies bring is Brazil (Campos and Santos Basins), Angola (Blocks 35, 36, and the ability to interpret the key geological markers and review 37), and over the majority of the central Gulf of Mexico and the spatial consistency/integrity of the interpretation in real- deepwater felds where TGS or their proprietary clients have time. In addition, new auto-tracking technologies enable the data.
interpreter to pick a few “seed” locations on key events and
OE: How is the imagery interpretation done after the allow algorithms to scan the volume to make the interpretation image is produced and how long does the process, from over the entire volume. In challenging areas such as pre-salt, receiving the data to producing and interpreting an image this strategy, while providing a good initial guess, is not often actually take?
good enough for a fnal interpretation, but the ability to rapidly
PGS view the data and make adjustments is essential. : The time taken from receipt of feld data through to imag-
SLB: Salt structures can take any kind of shape, therefore it is ing and fnal interpretation can take 6-18 months. The length of very important to be able to visualize the pre-salt formation from time is a function of the data volume and geological complex-
For more information email [email protected] or contact your local HYTORC representative every direction and angle possible. In Petrel, for example, the 3D ity – which can impact the complexity of the image processing visualization is native, so you are able to fy through your pre-salt workfow and the time required to interpret. Unfortunately,
The World’s Most Trusted Industrial Bolting Systems formation to visualize the full complexity of a reservoir. neither is an exact science, which can often lead to undesired
TGS: TTI modeling and migration exhibit better imaging in project delays while un-foreseen challenges are overcome. In
October 2014 | OE oedigital.com 26 000_1014_OE_Viz1.indd 26 9/23/14 11:03 AM