Page 74: of Offshore Engineer Magazine (Oct/Nov 2014)
Read this page in Pdf, Flash or Html5 edition of Oct/Nov 2014 Offshore Engineer Magazine
 73
73
 75
75
to these sub-regions (Fig. 3). Transaction data substantiates this shift into the new frontiers of
West Africa, heralding the ramp-up of further
Upstream prospects stay
West Africa exploration and develop- ment activity in the two sub-regions, notably in bright for West Africa
Ghana, Liberia, Senegal,
Guinea, Sierra Leone and
N. Foster Mellen analyzes West 2006. “Big oil” – the integrated majors local ? rms. Guinea-Bissau.
along with the other large international The Derrick data by deal type shows
African transactional activity
Potential resources by oil companies (IOCs) – accounted for the maturation of the region since 2006. and drilling rig data, which sub-basin another 20% of all deals since 2006. Transaction activity in the early years is indicates a promising future
The smaller, more-nimble and more- dominated by new exploration awards Con? dence in the sub- focused regional specialists accounted and then, in turn, followed by increasing regions’ resource poten- for the region.
for roughly another 15% of all upstream farm-in activity and the inevitable relin- tial is underpinned by transactions, with the remaining 45% quishment of some blocks. A new round the recent US Geological ontinuing strong upstream trans- made up of smaller independents and of exploration awards can also be seen Service (USGS) resource action activity starting in 2010. estimates for the West
C in West Africa Like historical oil and African region. According
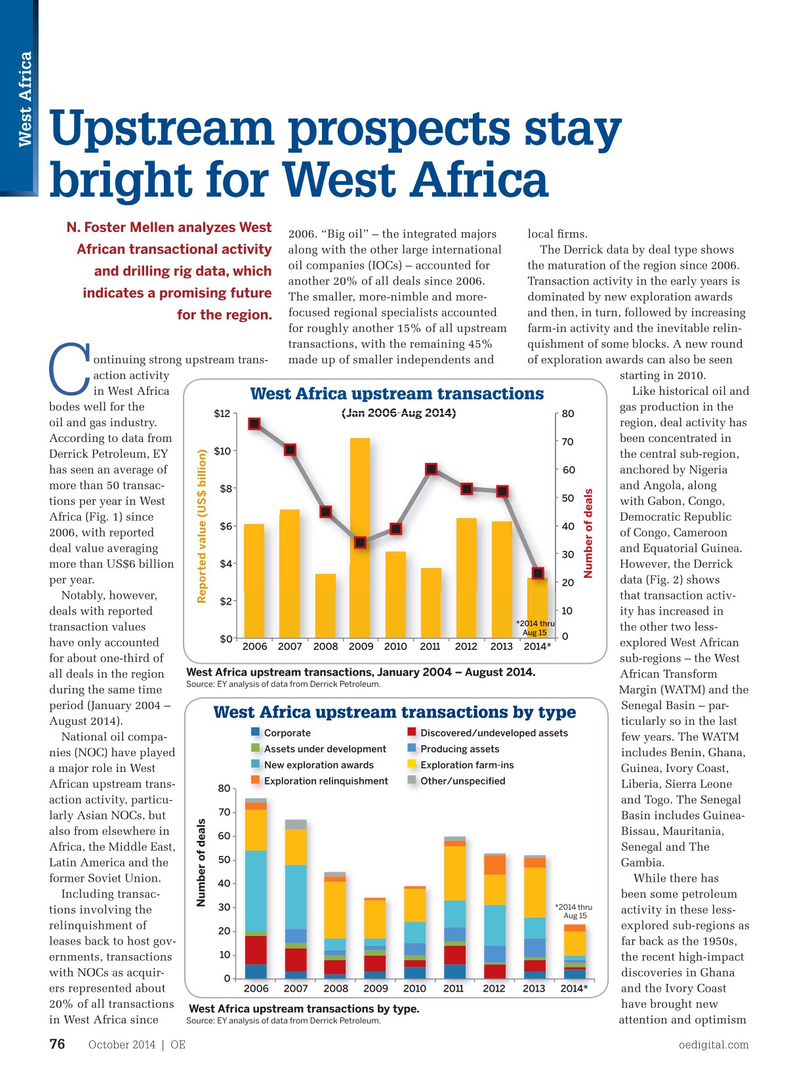
West Africa upstream transactions bodes well for the gas production in the to the USGS, the Senegal (Jan 2006-Aug 2014) (Jan 2006-Aug 2014) $12 80 oil and gas industry. region, deal activity has basin could contain almost
According to data from been concentrated in 5 billion bo and more than 70 $10
Derrick Petroleum, EY the central sub-region, 39Tcf of natural gas. The has seen an average of anchored by Nigeria WATM could contain more 60 more than 50 transac- and Angola, along than 18 billion bo and $8 50 tions per year in West with Gabon, Congo, more than 151Tcf of gas.
Africa (Fig. 1) since Democratic Republic Mean resource estimates $6 40 2006, with reported of Congo, Cameroon from the USGS indicate deal value averaging and Equatorial Guinea. that the two sub-regions 30 $4 more than US$6 billion However, the Derrick contain almost 10 billion
Number of deals per year. data (Fig. 2) shows bo (2.4 billion bbl for the 20
Notably, however, that transaction activ- Senegal basin and 7.3 $2 10 deals with reported ity has increased in billion bbl for WATM) *2014 thru transaction values the other two less- and almost 79Tcf of gas
Aug 15 0 $0 have only accounted explored West African (18.7Tcf for the Senegal 2006 2007 2008 2009 2010 2011 2012 2013 2014* for about one-third of sub-regions – the West Basin and 58.1Tcf for
West Africa upstream transactions, January 2004 – August 2014. all deals in the region African Transform WATM), along with almost 2.5 billion
Source: EY analysis of data from Derrick Petroleum.
during the same time Margin (WATM) and the bbl of natural gas liquids. While these period (January 2004 – Senegal Basin – par- estimates are substantially smaller than
West Africa upstream transactions by type
August 2014). ticularly so in the last the resource estimates for the central
Corporate Corporate Discovered/undeveloped assets Discovered/undeveloped assets
National oil compa- few years. The WATM sub-region’s mean oil resources of more
Assets under development Assets under development Producing assets Producing assets nies (NOC) have played includes Benin, Ghana, than 65 billion bbl and more than 134Tcf
New exploration awards New exploration awards Exploration farm-ins Exploration farm-ins a major role in West Guinea, Ivory Coast, of natural gas, they nonetheless are very
Exploration relinquishment Other/unspeci?ed
African upstream trans- Liberia, Sierra Leone attractive, particularly for the small-to- 80 action activity, particu- and Togo. The Senegal mid-sized independents.
70 larly Asian NOCs, but Basin includes Guinea-
A promising period for the region also from elsewhere in Bissau, Mauritania, 60
Africa, the Middle East, Senegal and The For the global oil and gas industry, 2013 50
Latin America and the Gambia. was not a particularly fruitful year for former Soviet Union. While there has discoveries; according to energy analyst 40
Including transac- been some petroleum consultancy ? rm Wood Mackenzie, total
Number of deals Reported value (US$ billion) *2014 thru 30 tions involving the activity in these less- discoveries were less than 17 billion
Aug 15 relinquishment of explored sub-regions as boe, well below the 26 billion boe aver- 20 leases back to host gov- far back as the 1950s, age over the previous 10 years. But 2013 10 ernments, transactions the recent high-impact was a productive year for Sub-Saharan with NOCs as acquir- discoveries in Ghana Africa, with the region accounting for 0 2006 2007 2008 2009 2010 2011 2012 2013 2014* ers represented about and the Ivory Coast almost 40% of the year’s total global 20% of all transactions have brought new discoveries. Notably, in 2013, West West Africa upstream transactions by type. in West Africa since attention and optimism Africa had three of the year’s 10 largest
Source: EY analysis of data from Derrick Petroleum.
October 2014 | OE oedigital.com 76 000_OE1014_Geofocus2_EY.indd 76 9/23/14 5:15 PM