
Page 76: of Offshore Engineer Magazine (Oct/Nov 2014)
Read this page in Pdf, Flash or Html5 edition of Oct/Nov 2014 Offshore Engineer Magazine
 75
75
 77
77
West Africa:
The continued story of the
West Africa “Haves” and the “Have-nots”
Jeremy Berry examines production capacity of 160,000bo/d,
Rig Max
Country months Rigs this is the fourth FPSO on the block.
the trend occurring of West Africa
Eni’s West Hub development in Angola • where exploration success
Angola 237 18
Block 15/06 is expected to start-up continues to be confned to those
Nigeria 186 14 in 2014, producing up to 80,000bo/d. countries that already have
Congo 615
The fnal investment decision (FID) on signifcant production.
Cameroon 433 the neighboring East Hub was made in
November 2013.
Gabon 344 est Africa, from Morocco in the • In February 2013, FID was announced
Ghana 20 2 on Mafumeira Sul in Chevron-operated north to Namibia in the south,
Equatorial Guinea 16 2
W
Block 0, offshore Angola. Production of produces about 6% of the
Cote d’Ivoire 10 3 100,000bo/d is expected to start in 2015.
world’s oil (averaging 5.2MMbo/d in April •
In July 2012, FID was announced on 2014; EIA’s International Energy Statistics).
DRC 91
West African production grew through the Lianzi feld operated by Chevron
Mauritania 81 the 2000s, reaching 5.5MMbo/d in 2010, in a unitized area between Congo
Morocco 51 but since then has shown an 8% decline and Angola. Production of up to
Togo 42 to today’s volumes. However, the region 46,000bo/d is expected in 2015.
• as a whole is responding, with 14% of the The Egina feld in Nigeria was
Namibia 41 current global offshore rig count active in approved for development by the
Senegal 31
Africa, up from 7% in 2004. The number Nigerian authorities in 2009, with
Liberia 31 of rigs active offshore Africa doubled in production of up to 200,000bo/d due to
Table 1: Total rig months (Jan 13 – Jul 14) 2010, and has continued to climb through is that by far and away the most active start in late 2017. Source: Baker Hughes Rig Count by country.
• to the current day (Fig. 1). areas are where the petroleum systems In April 2014, FID was announced by
Considering the news fow, one might have been proved to work and produc- Total for Kaombo in Angola ultra-deep- assume that this increase in rigs could tion, infrastructure and local support ser- water Block 32. Production is due to be driven by activity in new explora- vices are readily available (see table 1). start in 2017 at up to 230,000bo/d.
• tion areas, such as Namibia, Morocco, The activity levels seen in Table 1 are In May 2013, the Ghanaian authorities
Mauritania, or Liberia. However, these refected in the number of developments approved the Plan of Development frontier basins tend to share rigs (to approved and coming on stream in the for the TEN (Tweneboa, Enyenra, minimize mobilization costs) and their more active countries. Amongst key Ntomme) felds. First oil is scheduled contribution to the overall rig count examples are: for 2016, with a maximum production • is minimal, and will remain so until In June 2014, the CLOV development capacity of 80,000bo/d.
more positive results needing aggressive in Total-operated Block 17, deepwater Equally signifcant is the scale of suc- appraisal drilling materialize. The reality Angola, started production. With a cess of exploration drilling as illustrated
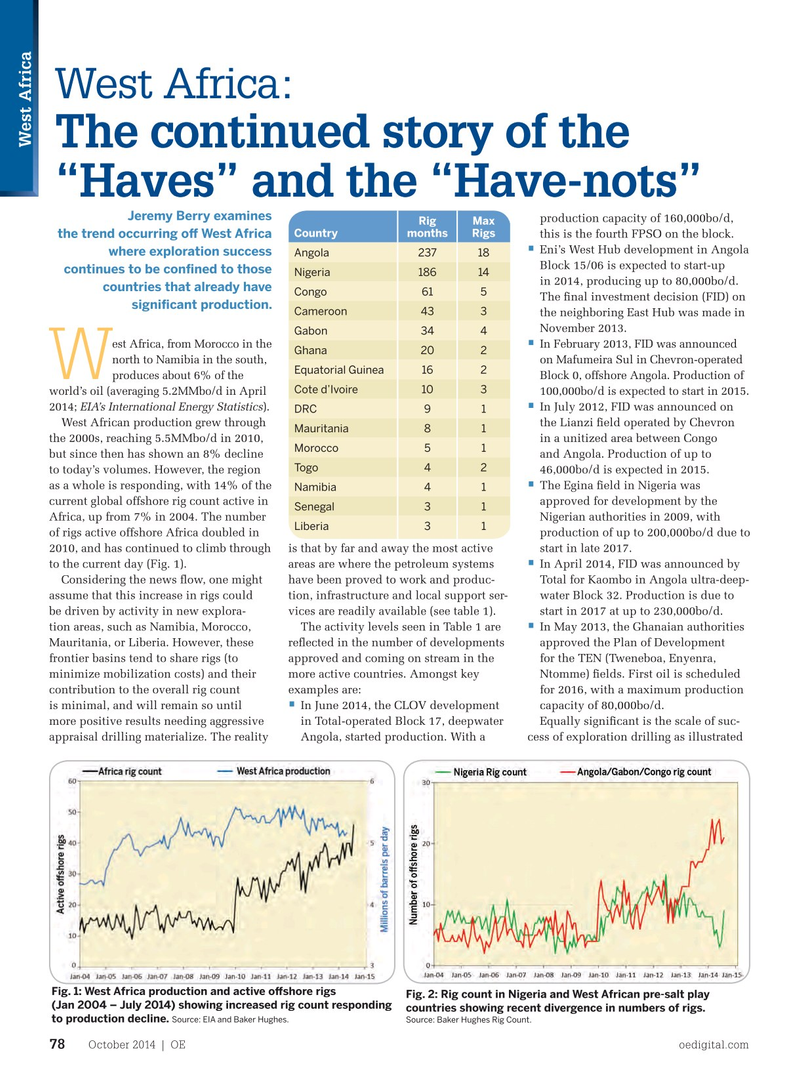
Fig. 1: West Africa production and active ofshore rigs
Fig. 2: Rig count in Nigeria and West African pre-salt play (Jan 2004 – July 2014) showing increased rig count responding countries showing recent divergence in numbers of rigs. to production decline. Source: EIA and Baker Hughes. Source: Baker Hughes Rig Count.
October 2014 | OE oedigital.com 78 076_OE1014_Geofocus1_gaffney.indd 78 9/23/14 5:25 PM