
Page 46: of Offshore Engineer Magazine (Jun/Jul 2015)
Read this page in Pdf, Flash or Html5 edition of Jun/Jul 2015 Offshore Engineer Magazine
 45
45
 47
47
(HPHT) environments where pressure, to create a model for sand transport in long-distance subsea volume and temperature (PVT) changes tiebacks. The ideal model would have the potential to solve are more pronounced and occur very problems of pipe and equipment sizing, locate places of sand quickly. Flow assurance issues can be deposition and improve sand management strategies. The previ- very costly to repair, or if unrepaired, can ous particle transport models did not refect the critical factor
Going with
Pipelines lead to erosion and corrosion and can of fow pattern transition and therefore can be unreliable under endanger asset integrity. Furthermore, varying operational conditions. deposition of solid matter reduces the Several experiments were conducted during a study to line throughput, sometimes leading to establish the minimum transport velocity (MTV) for rolling and the (model) fow complete blockages and making proft- suspension for different fow patterns. The result of that study able production of hydrocarbons practi- (Bello et al (2011)), were empirically derived equations for the
Modeling fow assurance regimes is no easy task, not least for cally impossible. MTV and fow velocity profles under different fow regimes. As long distance tiebacks, where the need for accurate modeling
Many researchers have attempted to a continuation of that study, the subsequent project was to cre- understand the physics of unprocessed ate an analytical model in MS Excel (using the concept of MTV) is crucial. Alexander Belkin outlines a model he has worked on.
fuid fow, characterized as multiphase to locate places of deposition in pipelines and to formulate a fow. Primarily, the scientifc efforts were method to assess the severity of blockages.
uring the past several decades, completions and the implementation focused on understanding the phase interaction between and its impact on of subsea processing, so unprocessed offshore oil and gas production Originally from Komi Republic, Russia,
D fow dynamics. The greatest diffculty reservoir fuids, often imbedded with has moved from shallow to deep Alexander Belkin earned his frst degree in is that the nature of the fow is transient particulate matter, are transported via the and ultra-deep water. Also, marginal Drilling Well Engineering in 2013 from due to constantly changing fow patterns, long-distance fowlines. Inevitably, fow felds located at substantial distances Ukhta State Technical University. He so it is hard to predict fow behavior. assurance problems such as hydrates, from host platforms have introduced the recently graduated from RGU with an MSc
As part of the development of a com- paraffn plugging and solids deposition need for long subsea fowlines, which are in Oil and Gas Engineering. prehensive subsea tieback management arise. Solids deposition, in particular, is often laid over hilly terrains. strategy, the Well Engineering Research related to insuffcient fow velocity. The economics of these types of Belkin presented this paper at the Energy
Group at Robert Gordon University in These problems become more challeng- developments quite frequently do not Institute’s Msc Energy Paper competition, in which he was one
Aberdeen, Scotland, has endeavored ing in high-pressure, high-temperature allow the installation of sophisticated of six fnalists. the solid phase was transported in suspension. It is important
Minimum transport velocity for rolling in the pipeline to note that the safest method of the solid phase transport is
The graph created in MS Excel demonstrates the MTV for rolling the production system, the project moved to the second phase in suspension, as when particles roll there is the possibility of changes in the pipeline. It is possible to locate the places where – creation of the analytical model in MS Excel with the main deposition as pressure drops further down the pipeline. it changes signifcantly and to calculate how much velocity is objective of fnding places of solid phase deposition. The solid In places of deposition, the severity of blockage is determined required to transport particles at specifc sections along the phase loading and dimensions were assumed, specifying the fow by the height of the deposited bed, which can show the degree pipeline route. The pipeline angle and fow regime are factors that as diluted with spherical particles. The fuid fow parameters were of production impairment. In this project it was attempted to infuence the MTV. transferred onto the Excel spreadsheet for calculations, which analytically derive it from the given equations. Evidently, the top
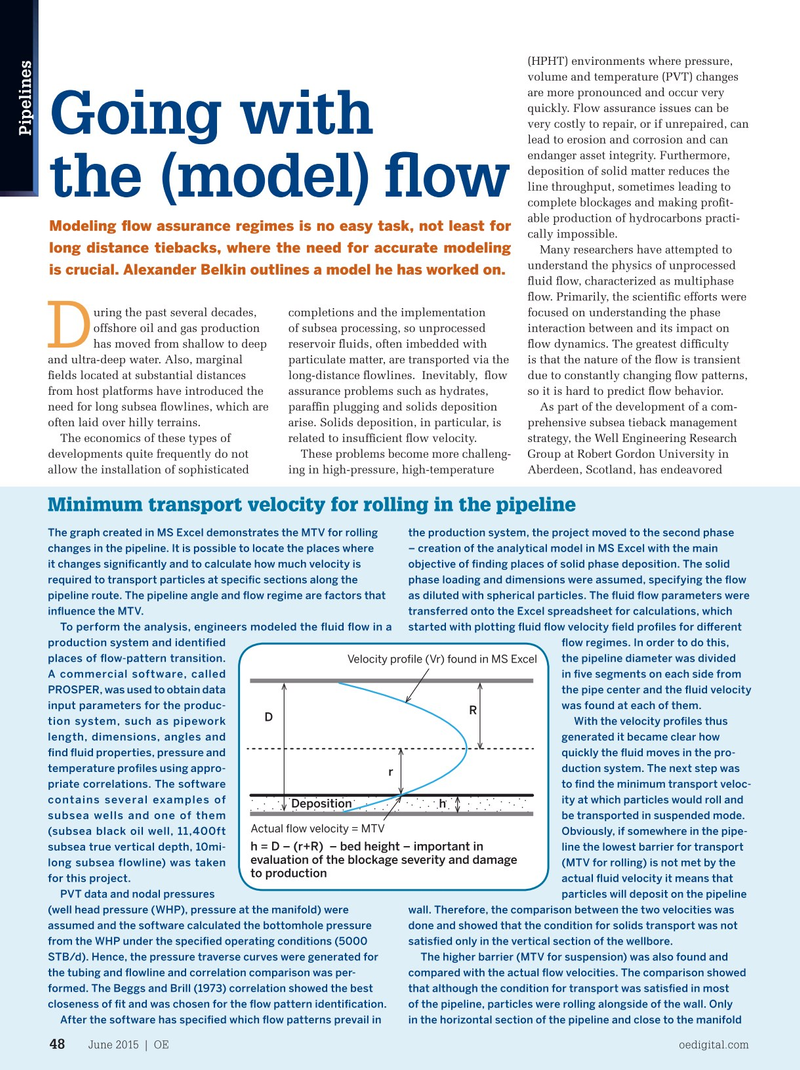
To perform the analysis, engineers modeled the fuid fow in a started with plotting fuid fow velocity feld profles for diferent of the deposited bed is at the point where transport occurs, in production system and identifed fow regimes. In order to do this, other words, where the actual fow velocity is equal to MTV for places of fow-pattern transition. the pipeline diameter was divided rolling. Thus, the two equations were equalized and the distance
Velocity pro?le (Vr) found in MS Excel
A commercial software, called in fve segments on each side from from the pipe center where transport occurs was expressed. It
PROSPER, was used to obtain data the pipe center and the fuid velocity then became possible to fnd the height of the bed by subtract- input parameters for the produc- was found at each of them. ing this distance from the rest of the pipe diameter space. The
R
D tion system, such as pipework
With the velocity profles thus method proved to be reliable and demonstrated only small error length, dimensions, angles and generated it became clear how margin (<0.5 %). fnd fuid properties, pressure and quickly the fuid moves in the pro- The project has laid the ground work for further develop- temperature profles using appro- duction system. The next step was ment and industrial application. Apart from enabling location of r priate correlations. The software to fnd the minimum transport veloc- places of deposition in the pipeline, it has given the insight into contains several examples of ity at which particles would roll and the key relationships between fow parameters and the solid
Deposition h subsea wells and one of them be transported in suspended mode. deposition behavior as well as severity of blockage. The next
Actual ?ow velocity = MTV (subsea black oil well, 11,400ft
Obviously, if somewhere in the pipe- step for this model will be its application in a feld case study h = D – (r+R) – bed height – important in subsea true vertical depth, 10mi- line the lowest barrier for transport and comparisons of results with a real-time data. There is the evaluation of the blockage severity and damage long subsea flowline) was taken (MTV for rolling) is not met by the opportunity to further complicate the model by adding parame- to production for this project. actual fuid velocity it means that ters close to a real case scenario (non-spherical particles, paraf-
PVT data and nodal pressures particles will deposit on the pipeline fn, hydrates and wax occurrence, dense fow, varying operating (well head pressure (WHP), pressure at the manifold) were wall. Therefore, the comparison between the two velocities was conditions).
assumed and the software calculated the bottomhole pressure done and showed that the condition for solids transport was not On demonstrating the reliability of this model and acknowl- from the WHP under the specifed operating conditions (5000 satisfed only in the vertical section of the wellbore. edging its practical importance it would be possible to incorpo-
STB/d). Hence, the pressure traverse curves were generated for The higher barrier (MTV for suspension) was also found and rate it into an industrial software. Thus, it would be a useful tool the tubing and fowline and correlation comparison was per- compared with the actual fow velocities. The comparison showed in the production engineer’s hands for predicting solid deposi- formed. The Beggs and Brill (1973) correlation showed the best that although the condition for transport was satisfed in most tion behavior in the production system under varying operating closeness of ft and was chosen for the fow pattern identifcation. of the pipeline, particles were rolling alongside of the wall. Only conditions. Subsequently, it might act as a part of an integrated
After the software has specifed which fow patterns prevail in in the horizontal section of the pipeline and close to the manifold subsea tieback fow assurance management strategy. •
June 2015 | OE oedigital.com 48 048_OE0615_Pipelines.indd 48 6/1/15 7:42 PM