
Strategic Planning With Aggregate Data
A sensor is a device that measures some kind of input from the physical world. On complicated technical systems such as vessels, there is an enormous amount of different sensors. The number of sensors will surely grow as the size and cost of sensors continuously decrease. A person technically trained is able to gain some information from a single sensor reading, but the information is much more useful when the data from multiple sensors and sources is combined and aggregated at a higher level. At a higher level the whole vessel can be seen as a moving sensor that is collecting data from environmental conditions as well as the performance of the vessel.
Similarly as the information received from a single sensor is limited, it is inadequate to interpret the information from only a single vessel. By combining the information from several vessels, it is possible to form a higher level view of the entire fleet and compare individual vessel performance by creating benchmarks and baselines. By comparing a vessel performance to another vessel, or even hundreds of other vessels, it is much easier to evaluate if individual vessel performance is up to the mark or not. Aggregating information from several vessels can bring insight about how the environmental conditions affecting vessel fuel consumption differ between sea areas.
When planning a budget, vessel operators need to estimate the fuel costs for a selected route. Fuel costs depend not just on the voyage distance, route and the schedule, but also on the environmental conditions the vessel is going to face on the voyage. An interesting measure when estimating cost of a specific route is considering the average sea margin that will be experienced in that sea area. Sea margin refers to the energy used by the vessel to overcome the environmental and sea conditions. In ideal conditions vessel sea margin would be zero.
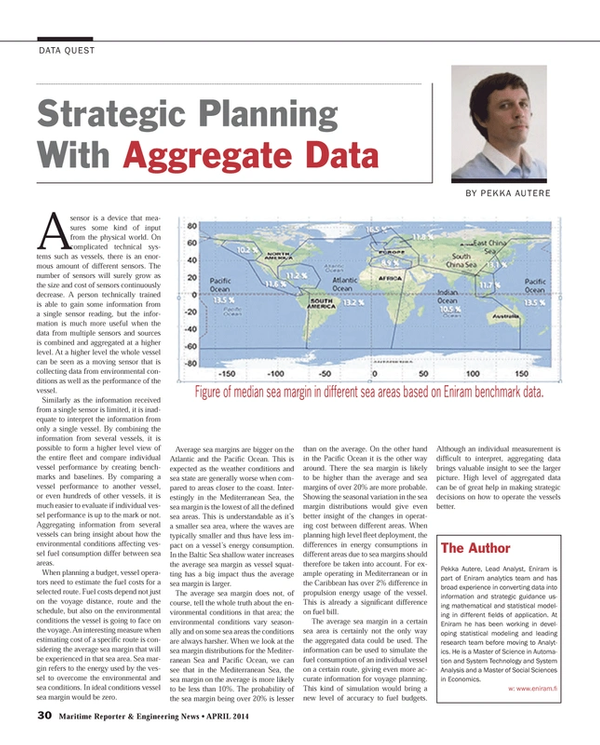
Average sea margins are bigger on the Atlantic and the Pacific Ocean. This is expected as the weather conditions and sea state are generally worse when compared to areas closer to the coast. Interestingly in the Mediterranean Sea, the sea margin is the lowest of all the defined sea areas. This is understandable as it’s a smaller sea area, where the waves are typically smaller and thus have less impact on a vessel’s energy consumption. In the Baltic Sea shallow water increases the average sea margin as vessel squatting has a big impact thus the average sea margin is larger.
The average sea margin does not, of course, tell the whole truth about the environmental conditions in that area; the environmental conditions vary seasonally and on some sea areas the conditions are always harsher. When we look at the sea margin distributions for the Mediterranean Sea and Pacific Ocean, we can see that in the Mediterranean Sea, the sea margin on the average is more likely to be less than 10%. The probability of the sea margin being over 20% is lesser than on the average. On the other hand in the Pacific Ocean it is the other way around. There the sea margin is likely to be higher than the average and sea margins of over 20% are more probable. Showing the seasonal variation in the sea margin distributions would give even better insight of the changes in operating cost between different areas. When planning high level fleet deployment, the differences in energy consumptions in different areas due to sea margins should therefore be taken into account. For example operating in Mediterranean or in the Caribbean has over 2% difference in propulsion energy usage of the vessel. This is already a significant difference on fuel bill.
The average sea margin in a certain sea area is certainly not the only way the aggregated data could be used. The information can be used to simulate the fuel consumption of an individual vessel on a certain route, giving even more accurate information for voyage planning. This kind of simulation would bring a new level of accuracy to fuel budgets. Although an individual measurement is difficult to interpret, aggregating data brings valuable insight to see the larger picture. High level of aggregated data can be of great help in making strategic decisions on how to operate the vessels better.
The Author
Pekka Autere, Lead Analyst, Eniram is part of Eniram analytics team and has broad experience in converting data into information and strategic guidance using mathematical and statistical modeling in different fields of application. At Eniram he has been working in developing statistical modeling and leading research team before moving to Analytics. He is a Master of Science in Automation and System Technology and System Analysis and a Master of Social Sciences in Economics.
w: www.eniram.fi
(As published in the April 2014 edition of Maritime Reporter & Engineering News - http://magazines.marinelink.com/Magazines/MaritimeReporter)
Read Strategic Planning With Aggregate Data in Pdf, Flash or Html5 edition of April 2014 Maritime Reporter
Other stories from April 2014 issue
Content
- Offshore: Seacor Raises the Bar Again page: 13
- Offshore Service Vessels Design Innovation page: 14
- U.S. Coast Guard Doing Less with Less page: 18
- New Conept Under Test: Arctic Drillship page: 20
- If You Have DPS Questions ... OSVDPA Has Answers page: 22
- How to Work with Your Insurer When Experiencing a Loss page: 24
- Calculating Settlement Value of a Case page: 26
- Strategic Planning With Aggregate Data page: 30
- Is Internal Combustion Engine Methane Slip Harmful to the Environment? page: 32
- Floating Production Growth May Face Obstacles page: 38
- Arctic Energy Exploration Efforts Heat Up page: 44
- Saipem: A Fleet Grows in Brazil page: 50
- Inside Paraguay’s Oil Boom page: 54
- The History of Offshore Energy page: 56
- Offshore Energy Timeline:1806-2014 page: 56
- C-MAR's Modern Approach to DP Training in Brazil page: 64
- CNR: Innovation Maintains US Naval Advantages page: 66
- STEM: SeaPerch Underwater Robotic Championships page: 72
- Safety the Focus as Heavy Lifting Picks Up page: 78
- Cool Runnings: R.W. Fernstrum's Engineered Solutions page: 82
- Rosie the Riveter: WWII Women Shipyard Workers Visit the White House page: 88
- Modern Solutions Power Systems Conference page: 91
- ABS Approves Design for GTTNA’s LNG Bunker Barge page: 92
- Rolls-Royce Wins Heyerdahl Award page: 94
- Damen Opens JV Yard in Vietnam page: 95
- BASS Launches New Fleet Management System page: 96
- Shipboard Pipe-joining Techniques Examined page: 98
- Luxury Yachts: Design Takes a New Track page: 100
- New Air Regulator from TDI page: 103
- DNV GL ShipManager for Entire H&P Fleet page: 103
- FARO Debuts X Series Laser Scanner page: 103
- Jinglu Chooses AVEVA Design Software page: 103
- Macro Sensors Gauge Tank Volume Changes page: 103
- Special Coupling Solution for Offshore Drives page: 103
- Conquest Offshore Buys Star Software page: 103
- Eniram Launches New Optimization Product for LNG Sector page: 104
- COSCO Selects Rolls-Royce Package page: 104
- New Tests for Ballast Water Contamination page: 104
- SSI Debuts Updated ShipConstructor page: 104
- Wärtsilä’s Launches Inline Scrubber System page: 104
- New Transas Liquid Cargo Handling Simulator page: 104
- New Hull Structure Analysis Software page: 104
- GEA Westfalia Separator Launches New Control Generation page: 105
- Omega Debuts Compact RTD Temperature Sensors page: 105
- New Heavy Duty CNC Plasma System page: 105
- Wärtsilä Introduces 46DF Dual Fuel Engine page: 105
- WSS Achieves Better Onboard Air Quality page: 105
- Trojan Marinex BWT System Earns IMO Type Approval page: 106
