Page 57: of Marine News Magazine (September 2011)
The Environmental Edition
Read this page in Pdf, Flash or Html5 edition of September 2011 Marine News Magazine
 56
56
 58
58
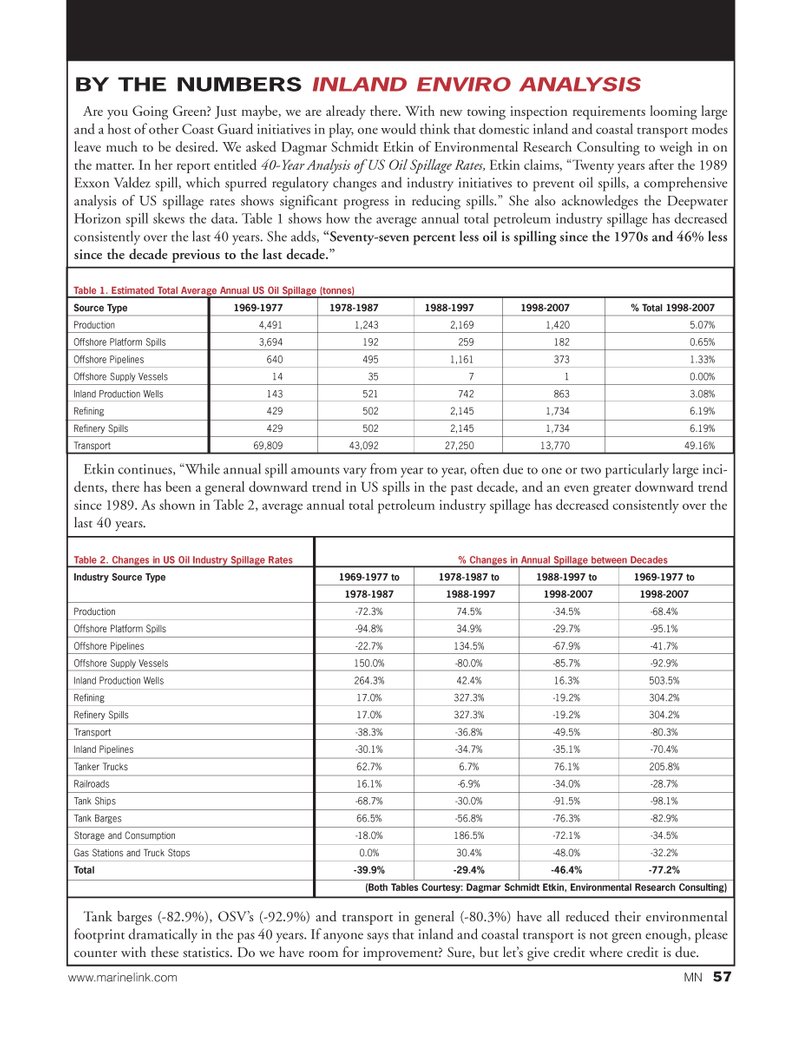
Are you Going Green? Just maybe, we are already there. With new towing inspection requirements looming large and a host of other Coast Guard initiatives in play, one would think that domestic inland and coastal transport modes leave much to be desired. We asked Dagmar Schmidt Etkin of Environmental Research Consulting to weigh in on the matter. In her report entitled 40-Year Analysis of US Oil Spillage Rates, Etkin claims, ?Twenty years after the 1989 Exxon Valdez spill, which spurred regulatory changes and industry initiatives to prevent oil spills, a comprehensive analysis of US spillage rates shows significant progress in reducing spills.? She also acknowledges the Deepwater Horizon spill skews the data. Table 1 shows how the average annual total petroleum industry spillage has decreased consistently over the last 40 years. She adds, ?Seventy-seven percent less oil is spilling since the 1970s and 46% less since the decade previous to the last decade.? Etkin continues, ?While annual spill amounts vary from year to year, often due to one or two particularly large inci- dents, there has been a general downward trend in US spills in the past decade, and an even greater downward trend since 1989. As shown in Table 2, average annual total petroleum industry spillage has decreased consistently over the last 40 years. Tank barges (-82.9%), OSV?s (-92.9%) and transport in general (-80.3%) have all reduced their environmental footprint dramatically in the pas 40 years. If anyone says that inland and coastal transport is not green enough, please counter with these statistics. Do we have room for improvement? Sure, but let?s give credit where credit is due. BY THE NUMBERS INLAND ENVIRO ANALYSIS Table 1. Estimated Total Average Annual US Oil Spillage (tonnes) Source Type 1969-1977 1978-1987 1988-1997 1998-2007 % Total 1998-2007 Production 4,491 1,243 2,169 1,420 5.07% Offshore Platform Spills 3,694 192 259 182 0.65% Offshore Pipelines 640 495 1,161 373 1.33% Offshore Supply Vessels 14 35 7 1 0.00% Inland Production Wells 143 521 742 863 3.08% Refining 429 502 2,145 1,734 6.19% Refinery Spills 429 502 2,145 1,734 6.19% Transport 69,809 43,092 27,250 13,770 49.16% Table 2. Changes in US Oil Industry Spillage Rates % Changes in Annual Spillage between DecadesIndustry Source Type 1969-1977 to1978-1987 to1988-1997 to1969-1977 to 1978-19871988-19971998-20071998-2007Production -72.3%74.5%-34.5%-68.4%Offshore Platform Spills -94.8%34.9%-29.7%-95.1%Offshore Pipelines -22.7%134.5%-67.9%-41.7%Offshore Supply Vessels 150.0%-80.0%-85.7%-92.9%Inland Production Wells 264.3%42.4%16.3%503.5%Refining 17.0%327.3%-19.2%304.2%Refinery Spills 17.0%327.3%-19.2%304.2%Transport -38.3% -36.8%-49.5%-80.3%Inland Pipelines -30.1%-34.7%-35.1%-70.4%Tanker Trucks 62.7%6.7%76.1%205.8%Railroads 16.1% -6.9%-34.0%-28.7%Tank Ships -68.7%-30.0%-91.5%-98.1%Tank Barges 66.5%-56.8%-76.3%-82.9%Storage and Consumption -18.0%186.5%-72.1%-34.5%Gas Stations and Truck Stops 0.0%30.4%-48.0%-32.2%Total -39.9% -29.4%-46.4%-77.2%(Both Tables Courtesy: Dagmar Schmidt Etkin, Environmental Research Consulting) www.marinelink.com MN57MN#9 (50-57):MN 2011 Layouts 9/6/2011 4:08 PM Page 57