
BY THE NUMBERS
The U.S. Coast Guard’s 2018 Domestic Annual Report on Flag State Control.
The U.S. Coast Guard’s 2018 Domestic Annual Report contains statistics regarding inspections and enforcement of regulations on U.S. flagged vessels. The report includes deficiency and detention rates for each type of inspected vessel, as well as performance metrics for Recognized Organizations that perform work on the Coast Guard’s behalf. The data contained in this report was compiled by the Office of Commercial Vessel Compliance (CG-CVC) using information from the Coast Guard’s Marine Information Safety and Law Enforcement (MISLE) database system.
For the first time, the coast Guard is presenting information reflecting the entire U.S. Flag fleet, including barges, cargo vessels, passenger vessels, vessels operating on the Outer Continental Shelf, research and school ships, fishing vessels, and the newest members of the inspected fleet, towing vessels. With the addition of towing vessels, which started getting inspected under 46 CFR Subchapter M in July of 2018, the size of the U.S. inspected fleet grew by approximately 6,500 vessels to a total fleet size of nearly 20,000 vessels, an increase of 50%. Unclear in all of that is why, if the U.S. commercial fleet numbers as many as 39,500 vessels, why ALL of these hulls aren’t being inspected.
In comparison to last year, which was the first year the Coast Guard published their annual report, the number of vessel inspections increased by 1,624 and the average number of deficiencies identified per inspection increased from 1.17 to 1.26, rising nearly 8%. That may have something to do with the introduction of all those previously uninspected subM hulls. Or, not. 2019 will show a clearer trend.
By the Numbers, the 2018 inspection data looks something like this in 2018:
40 (*): Number of U.S. flagged vessels were detained by USCG (8 months data only) |
75: PCT reportable marine casualties involving barges defined as collision, allision or grounding |
1,812: Number of vessels involved with reportable marine casualty investigations in 2018 |
1,946: Number of reportable marine casualty investigations in 2018 |
2,061: Number of inspected barges (43.5%) participating in Streamlined Inspection Program (SIP) |
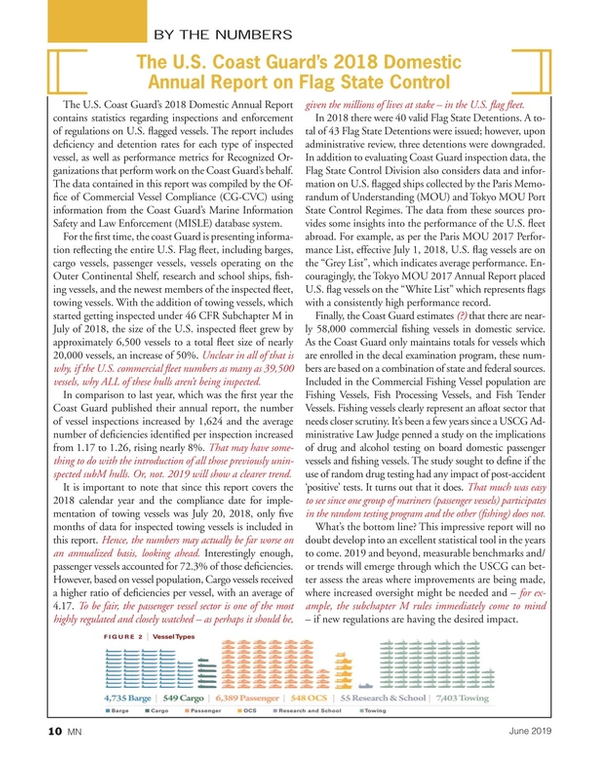
4,735: U.S. flag 2018 barge fleet, representing 24% of the overall U.S. inspected domestic fleet |
19,679: Number of U.S. flag vessels subject to inspection |
20,048: the number of inspections (US flag) conducted by USCG personnel |
25,324: the number of deficiencies found during those 20,048 inspections |
It is important to note that since this report covers the 2018 calendar year and the compliance date for implementation of towing vessels was July 20, 2018, only five months of data for inspected towing vessels is included in this report. Hence, the numbers may actually be far worse on an annualized basis, looking ahead. Interestingly enough, passenger vessels accounted for 72.3% of those deficiencies. However, based on vessel population, Cargo vessels received a higher ratio of deficiencies per vessel, with an average of 4.17. To be fair, the passenger vessel sector is one of the most highly regulated and closely watched – as perhaps it should be, given the millions of lives at stake – in the U.S. flag fleet.
In 2018 there were 40 valid Flag State Detentions. A total of 43 Flag State Detentions were issued; however, upon administrative review, three detentions were downgraded. In addition to evaluating Coast Guard inspection data, the Flag State Control Division also considers data and information on U.S. flagged ships collected by the Paris Memorandum of Understanding (MOU) and Tokyo MOU Port State Control Regimes. The data from these sources provides some insights into the performance of the U.S. fleet abroad. For example, as per the Paris MOU 2017 Performance List, effective July 1, 2018, U.S. flag vessels are on the “Grey List”, which indicates average performance. Encouragingly, the Tokyo MOU 2017 Annual Report placed U.S. flag vessels on the “White List” which represents flags with a consistently high performance record.
2018 Fleet Performance / By the Numbers (#)
TYPE / # US Flag | Inspections (#) | Deficiencies (#) | Deficiencies (ratio)/vessel | PCT of All Inspections | PCT of All Deficiencies |
Barges (4,735) | 5,469 | 1,857 | 0.39 | 27.3% | 7.3% |
Cargo Vessels (549) | 1,485 | 2,287 | 4.17 | 7.1% | 9.0% |
Pass. Vessels (6,389) | 11,018 | 18,311 | 2.87 | 55% | 72.3% |
Towing (7,403) (*) | 1,278 | 1,915 | 0.26 | 6.4% | 7.6% |
OCS / OSV (548) | 736 | 779 | 1.42 | 3.7% | 3.1% |
Schoolship/Research (55) | 121 | 175 | 3.18 | 0.6% | 0.7% |
(*) only 5 months of data available / (#) USCG inspections ONLY
Finally, the Coast Guard estimates (?) that there are nearly 58,000 commercial fishing vessels in domestic service. As the Coast Guard only maintains totals for vessels which are enrolled in the decal examination program, these numbers are based on a combination of state and federal sources. Included in the Commercial Fishing Vessel population are Fishing Vessels, Fish Processing Vessels, and Fish Tender Vessels. Fishing vessels clearly represent an afloat sector that needs closer scrutiny. It’s been a few years since a USCG Administrative Law Judge penned a study on the implications of drug and alcohol testing on board domestic passenger vessels and fishing vessels. The study sought to define if the use of random drug testing had any impact of post-accident ‘positive’ tests. It turns out that it does. That much was easy to see since one group of mariners (passenger vessels) participates in the random testing program and the other (fishing) does not.
What’s the bottom line? This impressive report will no doubt develop into an excellent statistical tool in the years to come. 2019 and beyond, measurable benchmarks and/or trends will emerge through which the USCG can better assess the areas where improvements are being made, where increased oversight might be needed and – for example, the subchapter M rules immediately come to mind – if new regulations are having the desired impact.
See the entire report by clicking: http://mlnk.co/uscg2108
This article first appeared in the June 2019 print edition of MarineNews magazine.
Read BY THE NUMBERS in Pdf, Flash or Html5 edition of June 2019 Marine News
Other stories from June 2019 issue
Content
- BY THE NUMBERS page: 10
- INSIGHTS: Joel Reid, Global Sales Director, COX Powertrain page: 14
- OP/ED: A Reassessment of the U.S. Marine Salvage Posture page: 20
- PROPULSION: The OXE Diesel Outboard Arrives page: 24
- Exceptional (Market) Reach Lifts a Crane Retrofit to Success page: 30
- SAFETY: Transitioning to LED Navigation Lights page: 34
- USMI: 35 Years and Going Strong page: 38
- SHORTSEA CRANE OPERATIONS: Lifting a Port to Prosperity page: 42
- Eye in the Sky for Inland INTEL page: 45