
Don't Let the Ocean Knock You Down
By Dean Steinke
For many years, moorings have been designed using basic mass-drag-buoyancy calculations, spreadsheets, rules-of-thumb, black magic scripts and a dose of ‘salty-sea-dog’ experience. With these methods one can frequently estimate a line size to use or an approximate anchor weight. But sometimes this isn’t good enough. This article looks at getting more precise with mooring analysis using numerical modeling software designed for ocean engineers.
Numerical modeling software for single point moorings has come a long way in recent years. Finite-element based cable analysis software has been tested and developed by oceanographic institutions and ocean engineers for various purposes (towed bodies, ROVs, moorings, etc). However, its use has been typically limited to a few advanced numerical modeling specialists who had both the expertise and patience to wade through the complex analysis process. In recent years, increasingly refined software has been developed. This software really benefits from increased computational power and advances in 3D graphics. We can now get a much clearer picture as to what is happening with our moorings subsurface.
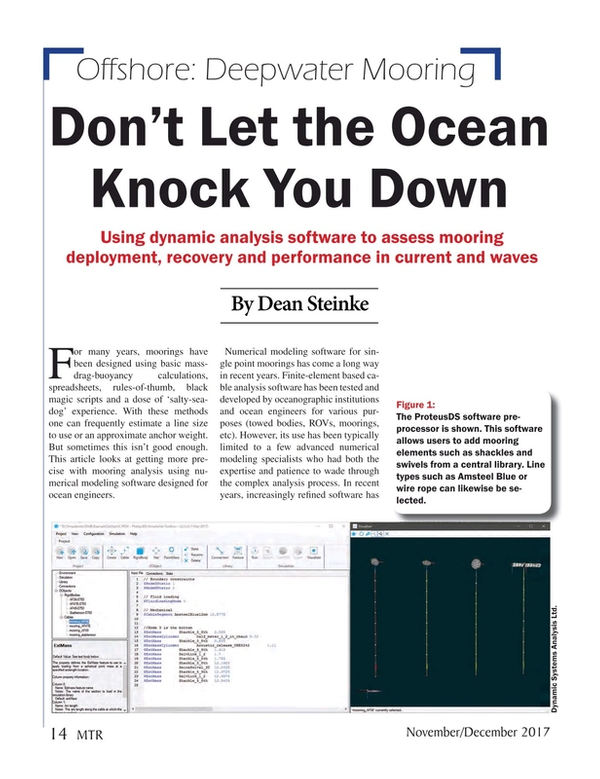
The article below outlines an analysis carried out by my firm, Dynamic Systems Analysis Ltd, using our ProteusDS software. We’re based in Canada and have cut our teeth over the last decade simulating many different types of ocean technologies, including single point moorings.
Analyzing Buoy Pitch and Knockdown in Current
The example shows four buoys of various styles (spherical, ellipsoid and streamlined) being loaded by current. As the current ramps up to 3.6 knots, the knockdown and pitch of the buoys increase. There are two key forces at play: buoyancy and drag. The buoyancy provides a vertical restoring force that keeps the buoy from pitching. Conversely, hydrodynamic drag pitches the buoys about their mooring connection point.
A pitch of greater than 20 degrees is not recommended for as ADCPs, as the inclinometers which allow for compensation of buoy pitch typically only have a range of 20 degrees. Most mooring designers would try to limit ADCP buoy pitch to only a few degrees if possible. Buoy pitch also depends on the length of the mooring, and weight of mooring equipment (chain, shackles, line, etc.) that the buoy is supporting.
The example shows that the buoyancy is effective in preventing knockdown and limiting pitch, as the AF49-750m buoy has the lowest pitch and knockdown of the ellipsoid and spheroid buoys. However, this buoy still pitches significantly. At higher current speeds is where the streamlined Stablemoor buoy with its reduced drag and configurable connection point is effective at maintaining low pitch and knockdown in the 3.6 knot currents tested.
The ProteusDS model uses a 6 degree of freedom for the buoys (heave, sway, surge, roll, pitch, yaw). Although this case is essentially 2D, the solver solves for the position in 3D.
Transient Loading and Acoustic Release Damage
One aspect not often considered by mooring designers is what happens during deployment. As shown in the example, the simulation allows for prediction of launch transients, which ensures that shackles and lines are properly selected to handle the deployment loads.
We’ve observed that acoustic releases get damaged during deployment when they are placed too close to the anchor. ProteusDS can be used to check that the acoustic release’s downward momentum will not cause it to crash into the seabed or anchor.
Mooring Recovery
A few questions I’ve been asked over the years: How long will it take for the mooring to come to the surface? How far might the mooring drift as it comes to the surface? In the case considered, the AF36-750m mooring rises at about 2.7 m/s. If this mooring was deployed at 750m, it would take between four and five minutes to surface.
Although no current was applied in the example, current can be applied in the simulation to determine how far it might drift in the time it takes to get to the surface. In an offshore environment, typically a mooring won’t drift too far.
Interaction of Waves with Subsurface Moorings
Much like current, waves can cause an ADCP mooring to pitch and move. This example shows the impact of the subsurface orbital wave motion on the mooring line and buoy. A JONSWAP wave spectrum is simulated to check if the buoy will pitch. Clearly, in this case, a bottom mounted ADCP frame would be preferred, but we don’t always have the equipment we need on hand. It’s good to have tools to check the impact of waves on our moorings.
DSA has carried out a series of simulations in consultation with DeepWater Buoyancy using our ProteusDS software. The software is designed to help mooring designers and builders to answer practical questions about mooring performance. The software’s 3D visualization capabilities are really cool, but I believe that the real value of the software is that we don’t have to guess what is happening subsea.
The Author
Dean Steinke is co-founder and Director of Operations, Dynamic Systems Analysis. He combines a mechanical engineering education with hands-on offshore experience.
(As published in the November/December 2017 edition of Marine Technology Reporter)
Read Don't Let the Ocean Knock You Down in Pdf, Flash or Html5 edition of November 2017 Marine Technology
Other stories from November 2017 issue
Content
- Don't Let the Ocean Knock You Down page: 14
- Around the World in 49 Days page: 24
- Optimizing the Tides page: 30
- Finding Monsters on the Ocean Surface page: 36
- Erie Hack: The Start to the Smart Lake page: 44