
Changes in Oil Trade Patterns and their Effects
With “America’s Energy Renaissance” oil trade patterns are changing. The impact is far reaching, but not easily defined.
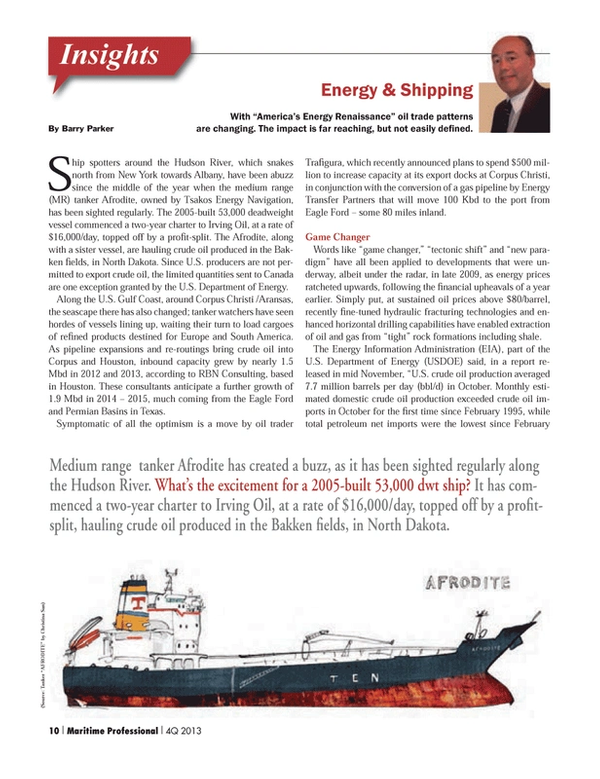
Ship spotters around the Hudson River, which snakes north from New York towards Albany, have been abuzz since the middle of the year when the medium range (MR) tanker Afrodite, owned by Tsakos Energy Navigation, has been sighted regularly. The 2005-built 53,000 deadweight vessel commenced a two-year charter to Irving Oil, at a rate of $16,000/day, topped off by a profit-split. The Afrodite, along with a sister vessel, are hauling crude oil produced in the Bakken fields, in North Dakota. Since U.S. producers are not permitted to export crude oil, the limited quantities sent to Canada are one exception granted by the U.S. Department of Energy.
Along the U.S. Gulf Coast, around Corpus Christi /Aransas, the seascape there has also changed; tanker watchers have seen hordes of vessels lining up, waiting their turn to load cargoes of refined products destined for Europe and South America. As pipeline expansions and re-routings bring crude oil into Corpus and Houston, inbound capacity grew by nearly 1.5 Mbd in 2012 and 2013, according to RBN Consulting, based in Houston. These consultants anticipate a further growth of 1.9 Mbd in 2014 – 2015, much coming from the Eagle Ford and Permian Basins in Texas.
Symptomatic of all the optimism is a move by oil trader Trafigura, which recently announced plans to spend $500 million to increase capacity at its export docks at Corpus Christi, in conjunction with the conversion of a gas pipeline by Energy Transfer Partners that will move 100 Kbd to the port from Eagle Ford – some 80 miles inland.
Game Changer
Words like “game changer,” “tectonic shift” and “new paradigm” have all been applied to developments that were underway, albeit under the radar, in late 2009, as energy prices ratcheted upwards, following the financial upheavals of a year earlier. Simply put, at sustained oil prices above $80/barrel, recently fine-tuned hydraulic fracturing technologies and enhanced horizontal drilling capabilities have enabled extraction of oil and gas from “tight” rock formations including shale.
The Energy Information Administration (EIA), part of the U.S. Department of Energy (USDOE) said, in a report released in mid November, “U.S. crude oil production averaged 7.7 million barrels per day (bbl/d) in October. Monthly estimated domestic crude oil production exceeded crude oil imports in October for the first time since February 1995, while total petroleum net imports were the lowest since February 1991.” Enhanced drilling and hydraulic fracturing have made this possible. Crude oil produced in Eagle Ford reached 400 Kbd barrels/day by late 2013 - more than double its levels of two years ago. In November, the USDOE was forecasting that crude produced in the Bakken region would exceed 1 Mbd, nearly triple the pace of 2011. The USDOE added, “EIA forecasts U.S. crude oil production will average 7.5 million bbl/d in 2013 and 8.5 million bbl/d in 2014.”
The International Energy Agency (IEA), representing a consortium of developed countries, looks for the U.S. oil (including gas liquids and condensate) production to reach 11.6 Mbd in 2020 (compared to 9.2 Mbd in 2012 ), exceeding that of Saudi Arabia. During the upcoming decade, China is forecast to become the world’s largest oil importer. But, what does all of that actually mean?
Energy’s Net Impact
Participants in the maritime business, ranging from fuel traders to ship spotters, have seen a multitude of impacts. Increased U.S. oil production has already led to reduced imports of crude oil; most dramatically, imports of crudes from West Africa (the same type of “light” oils characteristic of shale oil) have been reduced. These shipments (typically moving in Suezmax or VLCCs, have instead moved to Europe and Asia. VLCC shipments inbound from the Middle East (except for Saudi Arabia) have also declined. Imports into PADD 3 (the U.S. Gulf Coast) have dropped from a high of 7.9 Mbd in June 2005 to as low as 3.9 Mbd in February 2013. As imported oil has become more attractively priced (with a falling Brent – WTI spread), imports into PADD 3 rose up to 4.9 Mbd later in 2013.
Since 2005, product imports have fallen from 4 Mbd down to a rate of 2 Mbd. Exports have risen from around 1 Mbd to 3.3Mbd, as the U.S. has become a net exporter of products.
Perhaps the most vivid glimpse into the changing trades can be seen in the North Atlantic marketplace for MR tankers hauling refined products. Two important routes, Rotterdam/ New York and Houston / Amsterdam are both widely followed and closely analyzed by oil traders and shipowners. In the past two years, PADD 1 (East Coast) products imports have fallen from 1.6 Mbd down to 0.8 Mbd, while exports (llargely from PADD 3 representing the Gulf Coast) exports have risen from 1.5 Mbd to nearly 3.5 Mbd.
The actual time charter equivalent (TCE) hires experienced by operators of vessels in these trades have mirrored the USDOE statistics. Using calculations provided by the Baltic Exchange, which evaluates these routes (and many others) on a daily basis, shown in the graph, daily hires for the Rotterdam / New York route, with gasoline as the main cargo, have fallen steadily in 2013. The route now described as “the new front-haul” for such vessels, exports of diesel from Houston and Corpus Christi, to Amsterdam, has seen rising hires throughout the year. Indeed, it has bolstered the daily posting on the Baltic Exchange’s “MR basket” for a notional tanker making 14 knots on 36 tons /day of IFO consumption. Industry analysts estimate that daily results for “Eco-tankers” would likely be around $3,000/day higher. For example, if the Baltic basket shows $22,000/day, a 2013 built Eco-tanker (which would consume far less fuel) would likely return $25,000/day to its owners.
Without a doubt, the Energy Renaissance has, in part, also fueled the robust rebound of domestic, commercial blue water shipbuilding. And not a moment too soon. Sequestration fears have some big shipyards scrambling to shift their government backlogs to something a little more balanced. But, the current situation belays the notion that U.S. yards cannot survive without a steady diet of Navy and/or government work. Beyond this, the energy renaissance has some Jones Act freight rates soaring to record highs. For the time being then; so far, so good.
Unanswered Questions
Energy issues and attempts at forecasting go hand in hand; a number of important issues- with an unpredictable locus of geopolitics, environmentalism and economics are looming in the future. Though this article has emphasized the here and now – with a focus on movements of refined petroleum products, natural gas (found alongside crude oil and condensates in shale formations) is also part of the story. Beginning as early as 2016, the U.S. will begin exporting LNG from a handful of newly approved terminals in the Gulf Coast. Observers should be watching the willingness of the USDOE to continue granting approvals for exports, as well as the efforts of domestic consumers of natural gas (led by chemical producers who benefit from its availability and low price) to stymie continued export growth. Some twenty additional applications are said to be in the works.
Other questions worth asking concern crude oil exports – presently prohibited (unlike refined products such as diesel fuel and gasoline), with a handful of exceptions. The American Petroleum Institute (API), a trade association led by major oil companies, has publicly stated that it supports a fresh look at the applicable rules, and will be aiming for the elimination of restrictions on exports of crude oil. But, loosening crude oil export controls could also have the unintended effect of ending the most pronounced U.S. domestic shipbuilding cycle in three decades.
Aker Shipbuilding CEO Kristian Rokke, for example, embraces the “direct exposure to the shale boom and … the risk/reward of the investment.”
Any loosening of crude oil export limits and/or a softening of the Jones Act would therefore likely spell an end to the kinds of creative newbuild deals emanating from Aker that also help to sustain the current shipbuilding boom. A variation on this approach is the suggestion that the U.S. export light crudes (produced from shale), in an agreed swap for supplies of heavy crudes- suitable for many U.S. refineries.
Tanker trade patterns over a longer period are also highly uncertain. Attendees at numerous industry events and symposiums have heard that product movements are set to grow, which in the short term, appears to be the correct call. Over time, as drilling techniques successfully finetuned in North America spread across the globe, major “importers,” notably China, thought to be a big component of VLCC demand in the coming decade, may have their own versions of the Energy Renaissance. Likewise, LNG trades may be impacted by vast amounts of shale gas thought to exist in China, but also in Algeria and Argentina.
Another set of questions, presently without real answers, concerns the move of offshore oil exploration and production into deeper waters. Like “tight oil,” tapping offshore reserves becomes economical at higher oil prices. But, with vast new hydrocarbon supplies available onshore, will moves into inhospitable regions (for example, the Arctic reaches) and ultra-deep waters continue to be viable? And, if not, is the OSV building boom for the expected deepwater play also sustainable? And, of course, the big elephant in the room is the price of crude oil – with futurists wondering what might happen in the event of a prolonged lowering of the prices across the entire hydrocarbon barrel.
In the end, there will be benefactors and casualties as the ultimate outfall from “America’s Energy Renaissance.” More immediately, it is changing the equation of the energy transportation business and the countless variables that form the sum of its whole.
(As published in the 4Q 2013 edition of Maritime Professional - www.maritimeprofessional.com)
Read Changes in Oil Trade Patterns and their Effects in Pdf, Flash or Html5 edition of Q4 2013 Maritime Logistics Professional
Other stories from Q4 2013 issue
Content
- Aker Rhymes with “Soccer” page: 8
- Changes in Oil Trade Patterns and their Effects page: 10
- Maritime M&A: Financial Crisis to Present Day page: 16
- When is a Ship Not a Ship? page: 18
- NASSCO’s Parker Larson on All Things Shipbuilding page: 20
- Beyond Shipbuilding: Training and Recruitment page: 24
- The Aker Way: From Surviving to Thriving page: 32
- Converting for the Oil Market page: 40
- Damen Looks Offshore page: 43
- 3D Laser Scanning for the Marine Industry page: 46
- Technology Answers Risk and Security Questions page: 49
- Setting Standards for Maritime Security page: 52
- New Ballast Water Management Regulations page: 54