Page 10: of Marine News Magazine (September 2020)
Offshore Annual
Read this page in Pdf, Flash or Html5 edition of September 2020 Marine News Magazine
BY THE NUMBERS
U.S. Offshore Wind Outlook
While the market potential for offshore wind energy is which extends beyond 2030 installation that requires at large and well-documented, the United States is still only least $63 billion of capital expenditure. The country is an emerging player in this industry with no utility scale targeting 22GW of offshore wind by 2030 in line with projects in operation to date. But the U.S. could quickly issued federal leases.
become a top-? ve offshore wind power nation within a There is high-quality wind resource relatively close short period of time, with estimated investment require- to major demand centers. Of course, signi? cant poten- ment of at least $57 billion to install up to 30 gigawatts tial is found in the Atlantic along the East Coast, but (GW) by 2030 along the Atlantic Coast, according to the other regions such as Paci? c California and Hawaii, and
American Wind Energy Association (AWEA). even inland Lake Erie hold promise thanks to advancing
To date, only Ørsted’s ? ve-turbine 30 megawatt (MW) ? oating turbines that unlock deeper waters for offshore
Block Island Wind Farm in Rhode Island state waters is wind projects.
operational and grid connected, and a small pilot project There are two permit authorities for US offshore wind. is currently under development in federal waters offshore At federal level, the Bureau of Offshore Energy Manage-
Virginia. Three small demonstrators or prototypes have ment (BOEM), which sits within the Department of the previously been tested and decommissioned. Interior (DOI), is responsible for developing offshore re-
But there’s plenty more on the way. In 2016, the U.S. sources in federal waters (3-200nm) of the Outer Conti-
Department of Energy (DOE)-funded National Re- nental Shelf (OCS) and hosts lease auctions. For projects newable Energy Laboratory (NREL) produced a study less than nautical miles offshore and in inland lakes (such of the U.S.’s 10,800 GW of net technical offshore wind as Lake Erie) the permitting process is under control of energy potential, con? rming the signi? cant deeper wa- each state, and the DOE is the lead federal agency.
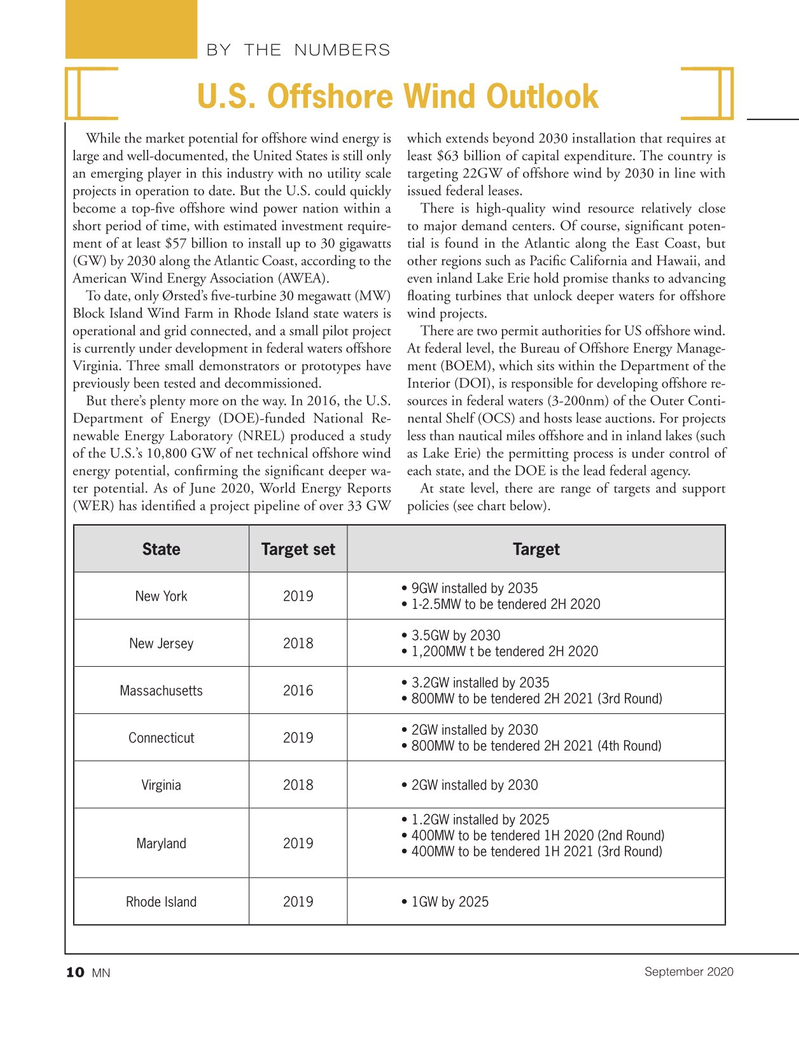
ter potential. As of June 2020, World Energy Reports At state level, there are range of targets and support (WER) has identi? ed a project pipeline of over 33 GW policies (see chart below).
State Target set Target • 9GW installed by 2035
New York 2019 • 1-2.5MW to be tendered 2H 2020 • 3.5GW by 2030
New Jersey2018 • 1,200MW t be tendered 2H 2020 • 3.2GW installed by 2035
Massachusetts2016 • 800MW to be tendered 2H 2021 (3rd Round) • 2GW installed by 2030
Connecticut2019 • 800MW to be tendered 2H 2021 (4th Round)
Virginia2018• 2GW installed by 2030 • 1.2GW installed by 2025 • 400MW to be tendered 1H 2020 (2nd Round)
Maryland2019 • 400MW to be tendered 1H 2021 (3rd Round)
Rhode Island2019• 1GW by 2025
September 2020
MN 10

 9
9

 11
11
