
The Economics of Slowing Down Ships
MarPro crunches the numbers on vessel steaming economics. What should you do? It all depends, says Barry Parker …
The topics of fuel efficiency, slow steaming and monetary savings have received tremendous attention from all sectors of the maritime business over the past few years. For operators of vessels burning heavy or intermediate fuels, the reasons are well known. High fuel prices (compared to historical levels) in the period from 2010 onward, and the prospects for even higher prices going forward as sulfur is squeezed out of fuels, have focused the eyes of C-level executives on fuel.
Starting in 2015, limits on sulfur emissions in Emissions Control Areas (ECAs) – which include the coasts of North America and Northern Europe – will drop to 0.1% from the present 1.0%. Down the road, in 2020, limits on sulfur emissions throughout the world are slated to drop to 0.5%, from the present 3.5%. Concern remains about the availability of marine distillates, where some 30 million tonnes are consumed annually by deepsea shipping.
Analysts at DNV-GL, in its Shipping 2020 report, suggest that annual demand six years out could exceed 200 million tonnes. Such predictions are behind the views of many commentators suggesting that the 0.5% deadline will be moved to 2025. The economics of fuel saving strategies, at a micro level – specifically, the trade-offs between cost savings and reduced revenues – have not always made it “above the fold” in numerous articles. Likewise, there’s been little synthesis of micro views with possible developments at the macro-economic level, when the wave of recent vessel orders hits the market and what happens when ships slow down.
The economic analysis here looks at impacts in the product tanker sector with notional voyages in the North Atlantic. Though a preponderance of product tanker ordering last year brought the whole ‘eco-ship’ debate to the fore, the observations apply to other market sectors in shipping. In theory, eco-ships can earn premiums because they cost less to operate. Conversely, hires for less efficient ships are discounted because of their higher costs.
MICRO
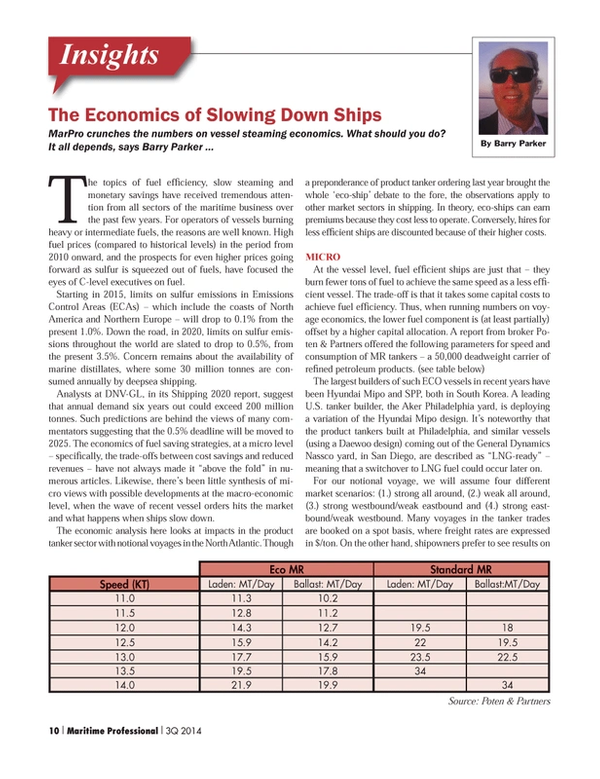
At the vessel level, fuel efficient ships are just that – they burn fewer tons of fuel to achieve the same speed as a less efficient vessel. The trade-off is that it takes some capital costs to achieve fuel efficiency. Thus, when running numbers on voyage economics, the lower fuel component is (at least partially) offset by a higher capital allocation. A report from broker Poten & Partners offered the following parameters for speed and consumption of MR tankers – a 50,000 deadweight carrier of refined petroleum products. (see table below)
The largest builders of such ECO vessels in recent years have been Hyundai Mipo and SPP, both in South Korea. A leading U.S. tanker builder, the Aker Philadelphia yard, is deploying a variation of the Hyundai Mipo design. It’s noteworthy that the product tankers built at Philadelphia, and similar vessels (using a Daewoo design) coming out of the General Dynamics Nassco yard, in San Diego, are described as “LNG-ready” – meaning that a switchover to LNG fuel could occur later on.
For our notional voyage, we will assume four different market scenarios: (1.) strong all around, (2.) weak all around, (3.) strong westbound/weak eastbound and (4.) strong eastbound/weak westbound. Many voyages in the tanker trades are booked on a spot basis, where freight rates are expressed in $/ton. On the other hand, shipowners prefer to see results on a time charter or $/day basis.
The holy grail for shipping number crunchers is the daily “time charter equivalent”, or TCE, which begins with freight rates expressed in $/ton of cargo carried. For analyzing impacts, shipping analysts will then look at a pro-forma voyage, where daily breakevens (the capital cost, and the vessel operating cost) are held constant. It’s then possible to look at sensitivities in the $/day net (equivalent to hire that would be earned on a time-charter, hence the name) resulting from changes in vessel freights, vessel speed, fuel prices and fuel consumption, under the four scenarios.
The calculations reveal some obvious findings and some that are not so obvious. In all four scenarios, the eco vessel shows a higher TCE than a conventional vessel. That’s intuitive. Less obvious though is the impact of slow steaming. In the strong market scenario (for both the conventional tanker and the eco tanker), the daily TCE actually drops when the vessel is slowed from 13 knots to 12 knots. By way of explanation, owners do better if they hurry up and get the next cargo. In weak markets, which are the norm, the daily return improves when slowing down, since reducing fuel expense has more impact than garnering marginal revenues that are actually below daily breakeven. In the two middle scenarios, where one trans-Atlantic leg is strong and one weak, the results are muddy, at best, with the conventional tanker seeing a very slight improvement in TCE from being slowed down.
There are two important realities that emerge from this type of analysis. First, in a very strong market, even the most fuel thirsty vessels will exceed their breakevens, including when running at maximum design speeds (in order to capture all those freight dollars). Charterers will pay for anything that floats, figuratively speaking, and owners of fuel guzzlers may slap down the discounts sought by charterers. In the strong market and the two directional strength examples here, TCE cash flow is positive – above the daily breakeven needed. There is a real return to equity, even for the non eco vessel.
The converse, our second fact of freight life, and the more frequently observed, is that in weak markets (which are the case in the proverbial “nine out of every 10 years”), vessels with a clear cost advantage will be cash-positive, even as they chase rates lower and lower. If there is a perception that hires (the $/day accruing to owners after deducting voyage expenses) will remain below breakevens, then vessels will exit the market (they will be scrapped).
Assume daily breakevens, including the capital and operating cost components, of around $13,000/day for a newly delivered eco-tanker operating in the trade, ordered for a price of approximately $35 million. For comparison, we can also look at an existing non eco-tanker, which could have a lower capital component (representing a five year old vessel purchased in the second hand market, for a price of around $28 million). However, its operating cost might be $600 to $1,200/day higher – as some proponents of eco tankers have claimed.
Tankers trading in the North American ECA will burn more expensive marine diesel oil (priced at around $1,000/ton) to comply with the maximum allowable sulfur content in fuel of 1.0%. Therefore, the calculations use a differential to reflect the additional cost, on the order of $300 to $400/ tonne of fuel, when inside the North American ECA.
MACRO
Shipping markets tend towards over-capacity; hence the notion of one good year each decade. Supply and demand models for shipping focus on “capacity utilization” to ascertain whether a particular sector will tighten up. For product tankers, data from Clarksons has been used to develop a highly simplified model of supply/demand interaction, making an arbitrary assumption that the boom market of 2005 represented 100% utilization. The graph shows the relationships between time charter hires (one year period), on the vertical axis, and utilization levels, on the horizontal axis. By this measure, when utilization exceeds 80%, we begin to see an upside breakout.
The models require a mix of art and science; both movements of “products” and the actual annual cargo deliverability of vessels are imprecise. Nevertheless, the first cut through the model, factoring in a conservative 2% growth in cargo flows, and a fleet expansion reflecting likely vessel deliveries for 2014 and some estimates of scrapping, shows the sector’s utilization to be mired between 70% and 75%. In other words, aside from temporary spurts (a feature of any of the shipping sectors), with a fleet of roughly 132 million dwt and nearly 1 billion deep-sea tonnes of “products” continuing to move annually in hauls averaging around 3,000 miles, there is no significant upward pressure, under normal market circumstances. Healthy demand growth over the next few years, and increasing lengths of voyages (as has been predicted for a number of years), would begin to change the equation.
Vessel supply, starting with the existing fleet at one point in time, reflects a forward delivery schedule, known with some certainty, tempered by a highly uncertain “deletion” schedule. Removal of vessels from supply typically occurs through scrapping. However, slow steaming also lowers the effective supply if it becomes a permanent feature of the marketplace – whether because of reduced design speeds, or as an ongoing reaction to high fuel prices. In econometric terms, it’s incorrect to look simply at deadweight tonnage, without adjusting it for reduced speeds, if the deadweight is permanently reduced.
However, the micro analysis demonstrates that shipowners have an incentive to speed up, in response to a stronger market. In contrast, the lower design speed of the eco tankers, fleet-wide, contributes to a true reduction in carrying capacity. With deliveries of eco tankers only beginning in recent years, this effective reduction in deadweight is small, in comparison to the overall product tanker fleet. Hence, there is no significant permanent reduction in deadweight just yet.
Another variable will begin creeping into discussions of vessel supply. The pace of adaptation for the new fueling solution coming on the scene (LNG), will have an important impact on whether “uneconomical” vessels are retrofitted for better fuel consumption, or simply removed from the fleet. DNV-GL, in its Tanker Update (#1) for 2014, estimates the incremental additional cost of a newbuild dual fueled tanker (meaning that it can burn both LNG and conventional IFO), to be slightly less than $6 million. The authors, Martin Chr. Wold and Kjersti Aalbu, point out that such a vessel “… will be an attractive choice for trades with ECA exposure.” The authors, part of the “DNV-GL LNG Ready” service, also note that: “The first orders are likely not far away.” As the industry slides down the learning curve, this price could fall in coming years.
Another Kind of Change in Speed
Shipping people of a certain age may be so familiar with the types of analysis shown in this article that they can perform them on the “back of an envelope”- with accuracy rivaling that of a good Excel spreadsheet. But economics will be changing, as new technologies impact maritime propulsion. Already, engine manufacturers, shipowners and their advisors are developing algorithms for TCE’s where LNG (and even methanol), rather than intermediate or heavy fuel, provides power. Technologists promoting wind power have developed calculations that quantify cost savings from investments in sails or rotors, working back, in turn, to TCEs. In the years ahead, the old envelope won’t be suitable, as calculations consider impacts of new fuels and new technologies.
(As published in the 3Q 2014 edition of Maritime Professional - www.maritimeprofessional.com)
Read The Economics of Slowing Down Ships in Pdf, Flash or Html5 edition of Q3 2014 Maritime Logistics Professional
Other stories from Q3 2014 issue
Content
- The Economics of Slowing Down Ships page: 10
- Nobody Rides for Free … page: 18
- Fuel Management & Safety page: 20
- Moving Ahead with MLC: the true course to compliance. page: 36
- Profile: Coast Guard Administrative Law Judge Brudzinski page: 40
- Evolving Threats Met by Market Innovation page: 42
- Seafarer Shore Leave: MLC Business, or Not? page: 47
- Searching for a career with Military Sealift Command? page: 54
- Newport News Fosters Home-grown Talent page: 58
- Maritime Training & Employment Numbers page: 62